
By Gary Stringer, Kim Escue and Chad Keller, Stringer Asset Management
Our outlook continues to be constructive and built on solid U.S. economic fundamentals. Due to the market rally that began late last year, we now find U.S. equities to be fairly valued rather than attractively valued as at the beginning of 2019. As we stated earlier this year, last year’s stock market decline offered a compelling opportunity due to the magnitude of the price-to-earnings (P/E) ratio compression. Over the last 50 years, when the S&P 500 Index forward 12-month ratio has been as low as it was in late December at 14x, the S&P 500 Index appreciated 27% over the next 12 months on average.
Though the equity markets have recovered significantly since December’s lows, we think there is still more upside to this market. However, we recognize that there are significant risks to the global economy and the markets. We estimated that about half of last year’s equity market declines were associated with what we view as non-fundamental risks to the U.S. economy, such as trade wars and other geopolitical threats.
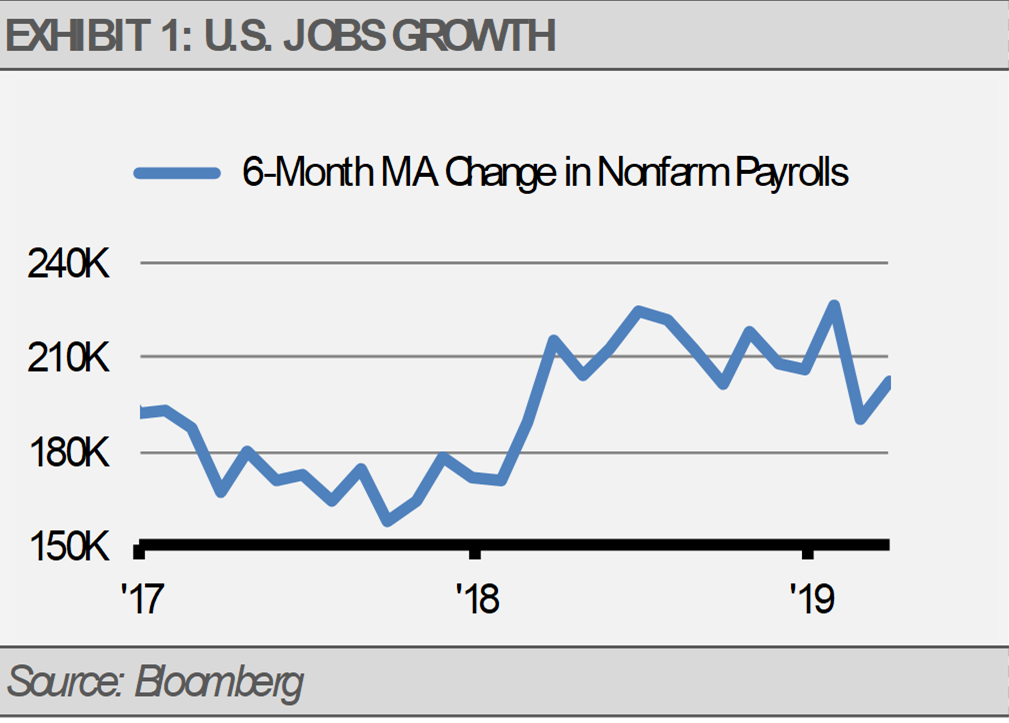
We continue to think that the primary risk to the U.S. economy and the continuation of the business cycle is U.S. Federal Reserve (Fed) policy. Given solid jobs growth, slowing money growth, lower market-based inflation expectations (TIPS spreads), the flattening or inverted yield curve, and the slowing pace of economic growth, we thought that the Fed should stop raising interest rates and declare victory.
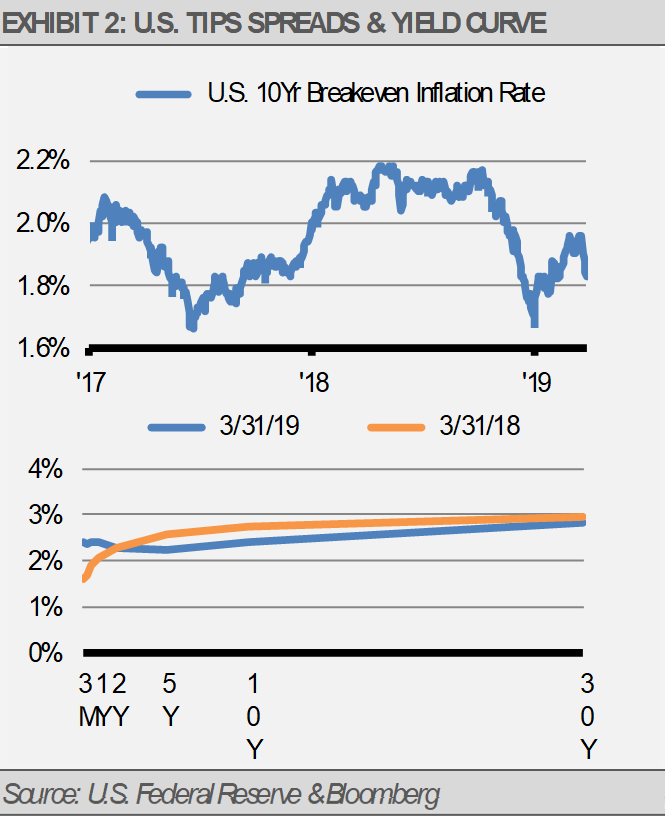
With the yield curve inverted, at least briefly, and money growth slowing, two of our leading indicators are now flashing yellow, but not red. Other signals like weekly jobless claims (exhibit 3), the year-over-year change in the unemployment rate, and credit spreads suggest slow and steady growth ahead. Meanwhile, market sentiment remains constructive, in our view.

With the Fed pivot away from raising short-term interest rates to now expecting no more interest rate hikes this year, we thought that this business cycle would continue, corporate revenues and earnings would grow, and stock prices would move higher. We now think the Fed should cut interest rates in 2019 due to economic weakness in foreign economies, such as Europe, that is bringing down long-term interest rates.
The market for long-term U.S. Treasuries is a global market. Low interest rates abroad can hold down long-term interest rates at home. One of the primary reasons that foreign economies and markets affect U.S interest rates is because some of the largest purchasers of U.S. Treasuries are global institutions, such as central banks, insurance companies, and pension plans.
Lower interest rates in foreign economies make U.S. Treasuries more attractive to those buyers, thus increasing demand for U.S. Treasuries and pulling down long-term U.S. interest rates. In turn, we think that the Fed should follow the natural interest rates down or they run the risk of stifling U.S. economic activity through a liquidity crunch.
INVESTMENT IMPLICATIONS
Overall, our view on the equity markets favor the U.S. and emerging markets, while we remain underweight Europe and Japan. According to the latest update of the J.P. Morgan Global Composite PMI report, the rate of global economic growth accelerated in March (exhibit 4). This growth was led by the U.S. while strength in emerging markets, such as China, added to global economic stabilization. Similar data from Europe and Japan suggest further weakness ahead for those economies. As a result, we continue think the U.S. economy will generate growth at a rate better than developed foreign markets.

Investors might look towards U.S. sectors with companies that generate the majority of their revenue domestically rather than from foreign economies, such as the consumer discretionary sector and medical device industry.
We think that continued strength in the U.S. labor market will support growth in spending. While organic economic growth in the U.S. continues, so does the recovery in the U.S. labor market. The U.S. labor force gains roughly 100,000 new entrants each month due to population growth, and we think there is an additional one million entrants that could reenter. With roughly seven million open jobs in the U.S., our economy has plenty of capacity both in available jobs and in available workers.

With the Fed no longer raising short-term interest rates, we think we have seen a near-term peak in the U.S. dollar exchange rate. Emerging market stock prices tend to have an inverse relationship to the dollar as evidenced in the strengthening of the U.S. dollar exchange rate last year and the weakness in emerging market stock prices.

A weakening U.S. dollar combined with more stimulative economic policies in China, such as a decline in bank reserve requirement ratios and a commitment to more fiscal spending, supports an optimistic view for China and emerging Asia more broadly. Any positive developments on U.S.-China trade negotiations would be a bonus to this view. We think that emerging market equities will benefit from these shifts.
To summarize, we think the most likely outcome includes Fed interest rate cuts, a continuation of the business cycle, and higher equity prices. As a result, we are deploying capital in areas that we think will benefit from this environment. However, if the Fed does not recognize the risks associated with lower rates abroad holding down domestic interest rates, we would respond quickly by paring back on equities while increasing our allocations to high-quality bonds and cash. In 2019, we think that it will be critical for investors to be ready for such a binary set of potential outcomes.
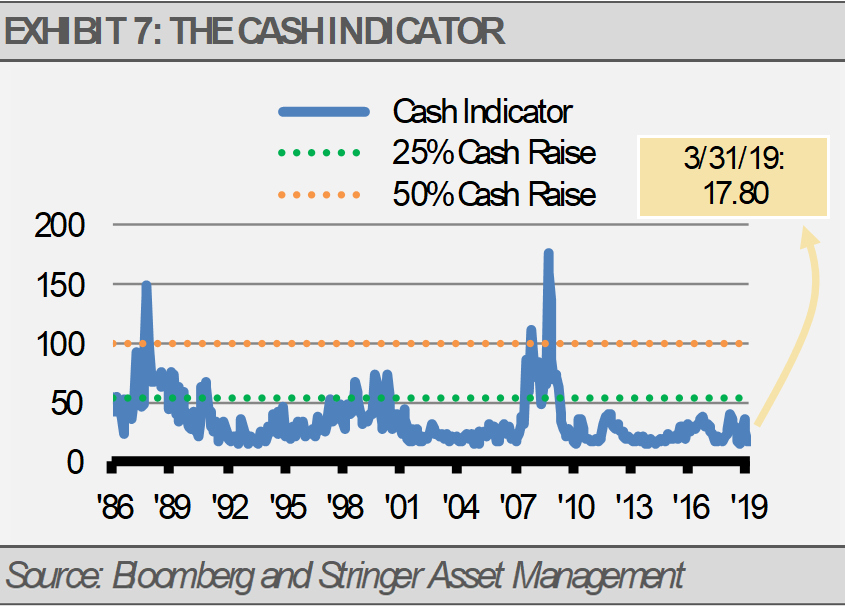
We think it will be important to continue to put risk first while also being ready to act tactically to benefit from a continued equity market recovery. Equally crucial, we think that investors should be ready to take defensive tactical positions, along with the willingness and ability to raise cash up to 50% of a portfolio as can be done via our Cash Indicator methodology.
We are watching our indicators closely and will make adjustments quickly if we sense problems or other opportunities ahead. That flexibility is one of the benefits of including a tactical allocation where we can manage risk in real time.
CASH INDICATOR
The Cash Indicator (CI) has declined to the low end of its historical range. While the CI is far from a level that would have us getting more defensive, levels this low reflect market complacency that rarely last long. We expect volatility to return to the markets, but any selloff is likely to be minimal and short-lived.
This article was written by Gary Stringer, CIO, Kim Escue, Senior Portfolio Manager, and Chad Keller, COO and CCO at Stringer Asset Management, a participant in the ETF Strategist Channel.
DISCLOSURES
Any forecasts, figures, opinions or investment techniques and strategies explained are Stringer Asset Management, LLC’s as of the date of publication. They are considered to be accurate at the time of writing, but no warranty of accuracy is given and no liability in respect to error or omission is accepted. They are subject to change without reference or notification. The views contained herein are not be taken as an advice or a recommendation to buy or sell any investment and the material should not be relied upon as containing sufficient information to support an investment decision. It should be noted that the value of investments and the income from them may fluctuate in accordance with market conditions and taxation agreements and investors may not get back the full amount invested.
Past performance and yield may not be a reliable guide to future performance. Current performance may be higher or lower than the performance quoted.
The securities identified and described may not represent all of the securities purchased, sold or recommended for client accounts. The reader should not assume that an investment in the securities identified was or will be profitable.
Data is provided by various sources and prepared by Stringer Asset Management, LLC and has not been verified or audited by an independent accountant.
Index Definitions:
MSCI Emerging Markets Index – This Index is a free-float weighted equity index that captures large and mid cap representation across Emerging Markets (EM) countries. The index covers approximately 85% of the free float-adjusted market capitalization in each country.
S&P 500 Index – This Index is a capitalization-weighted index of 500 stocks. The Index is designed to measure performance of a broad domestic economy through changes in the aggregate market value of 500 stocks representing all major industries.
U.S. Dollar Index – This Index indicates the general international value of the US dollar. The USDX does this by averaging the exchange rates between the USD and major world currencies. The ICE US computes this by using the rates supplied by some 500 banks.
