
by Komson Silapachai, Research & Portfolio Strategy
Key Takeaways
- Yields have repriced across the curve to reflect the Fed’s hawkish stance in response to persistently high inflation. For longer-term investors, all-in yields in investment grade bond sectors have doubled since the start of the year to the highest level in over 15 years, presenting an interesting opportunity to allocate into the asset class.
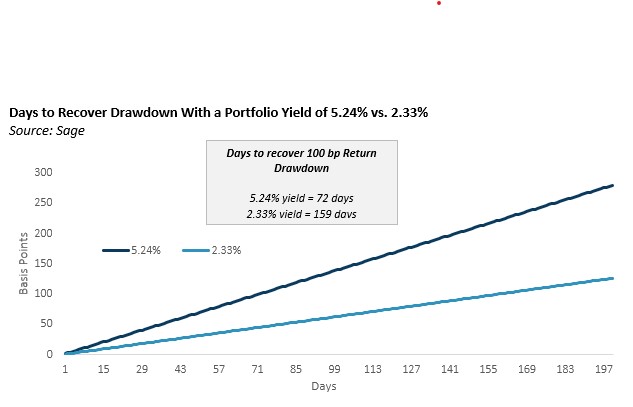
- The fixed income yield cushion is much higher given the prevailing level of yields. As compared to the start of the year, a bond yielding 5.24% (currently the yield of IG Corporates) would recoup a 1% drawdown in 72 days versus 159 days for a bond yielding 2.33% (the corporate bond yield at the start of 2022).
- Additionally, given the dramatic flattening of the yield curve, shorter maturity sectors offer superior risk/return characteristics as investors can achieve a similar yield/income profile without taking excess interest rate risk.
The long-awaited September FOMC statement and summary of economic projections arrived, and it met the expectation coming with a “hawkish” 75 basis point rate hike. However, the Fed’s projections of future rate hikes was more hawkish than expected. The market is now pricing in a Fed Funds rate in the 4.25%-4.50% range by year end. This implies an additional 100-125 bps of hikes through the end of 2022, with a 75bp hike in November followed by a 25-50bp hike in December. Overall, the Fed remained resolute in its fight against inflation and the September statement is a continuation of that.
The good news for bond investors is that the yield curve has largely priced in this more hawkish path for Fed Funds. In fact, fixed Income yields now stand at the highest level since 2007. No doubt, the asset class now has more “yield cushion” to absorb further price volatility, especially for long term investors. In this piece we examine the prevailing yields offered by various fixed income sectors and returns under different yield scenarios over the coming months.
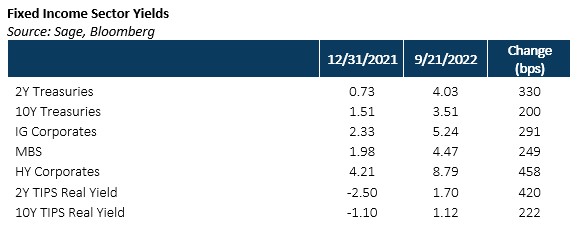
Looking across various fixed income sectors, yield levels reflect the massive repricing of fixed income that has occurred throughout the year. The two-year Treasury yield, which yielded only 0.75% at the start of the year, now stands over 4% – the highest level since 2007. For long term investors, yields on investment grade fixed income are compelling, with the yield-to-worst on investment grade corporates at 5.24% and MBS at 4.35%, more than double the yield level at the start the year.
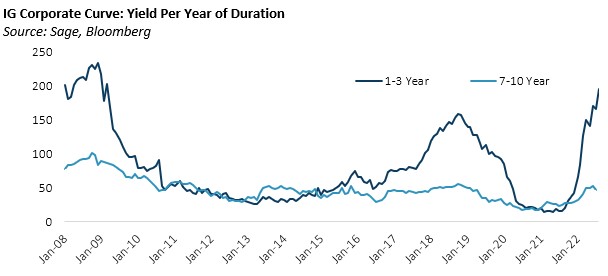
The shape of the yield curve has also transformed as the markets repriced to reflect the reality of a hawkish Fed. The 2y/10y Treasury yield spread flattened from +0.78% to start 2022 to -0.52% currently. In a flat/negative yield curve environment, shorter maturity fixed income offers superior risk-adjusted returns to the rest of the fixed income complex with the highest yields adjusted for duration. The chart on below shows the superior yield per year of duration in short-term bonds.
While we believe the market’s pricing of 4.25%-4.5% terminal Fed Funds rate should likely be near the peak yield level of this hiking cycle, what if yields continue to rise? How much “cushion” does a bondholder have given a prevailing rise in yields? The chart below illustrates the return drawdown of a bond at a given yield, versus the number of days it would take to recoup the drawdown. We use the current yield of IG corporates (5.24%) versus its starting yield at the beginning of the year (2.33%). At today’s elevated yield levels, investors would recoup a 100 basis-point drawdown in 72 days (holding yields constant), compared to a 159 day recovery period for a portfolio yielding 2.33%.
Thus far this year the investment grade and high yield credit sectors have suffered the brunt of the investor withdrawals or liquidations, contributing to reduced market liquidity and concurrent yield spread widening. These trends are clearly indicated in the chart above. Interestingly, despite the rising rate environment, investor flows have remained positive for U.S. government-focused funds, with the bulk of those positive flows going into short-term investment strategies in anticipation of higher interest rates and a further weakening of the economic environment.
Disclosures: This is for informational purposes only and is not intended as investment advice or an offer or solicitation with respect to the purchase or sale of any security, strategy or investment product. Although the statements of fact, information, charts, analysis and data in this report have been obtained from, and are based upon, sources Sage believes to be reliable, we do not guarantee their accuracy, and the underlying information, data, figures and publicly available information has not been verified or audited for accuracy or completeness by Sage. Additionally, we do not represent that the information, data, analysis and charts are accurate or complete, and as such should not be relied upon as such. All results included in this report constitute Sage’s opinions as of the date of this report and are subject to change without notice due to various factors, such as market conditions. Investors should make their own decisions on investment strategies based on their specific investment objectives and financial circumstances. All investments contain risk and may lose value. Past performance is not a guarantee of future results.
Sage Advisory Services, Ltd. Co. is a registered investment adviser that provides investment management services for a variety of institutions and high net worth individuals. For additional information on Sage and its investment management services, please view our web site at www.sageadvisory.com, or refer to our Form ADV, which is available upon request by calling 512.327.5530.
