
Last Week’s Macro Data:
- Headline inflation continued to cool in April as annualized CPI (Consumer Price Index) eased for the tenth straight month. However, all prints remain stubbornly high:
-
- Headline CPI rose 4.9% year over year, coming in just short of the 5.0% consensus and slightly below March’s 5.0% increase. It gained 0.4% month over month, matching estimates but up from the prior month’s 0.1% measure.
- Core CPI (excluding food and energy) was up 5.5% year over year, slightly ahead of the 5.4% forecast but cooling slightly from March’s 5.6% print. It increased 0.4% month over month, also greater than the expected 0.3% rise but in line with the previous month’s reading.

- Inflation also continued to ease in April via PPI (Producer Price Index) as most readings came in softer than expected. Both annualized measures cooled relative to the prior month:
-
- Headline PPI rose 2.3% year over year, printing just below the 2.4% forecast and decreasing from March’s 2.7% gain. It increased 0.2% month over month, slightly cooler than the 0.3% estimate but up from the prior month’s 0.4% decrease.
- Core PPI (excluding food and energy) rose 3.2% year over year, coming in short of the expected 3.3% and declining from March’s 3.4% measure. It was up 0.2% month over month, in line with the consensus but up from the previous month’s flat reading.

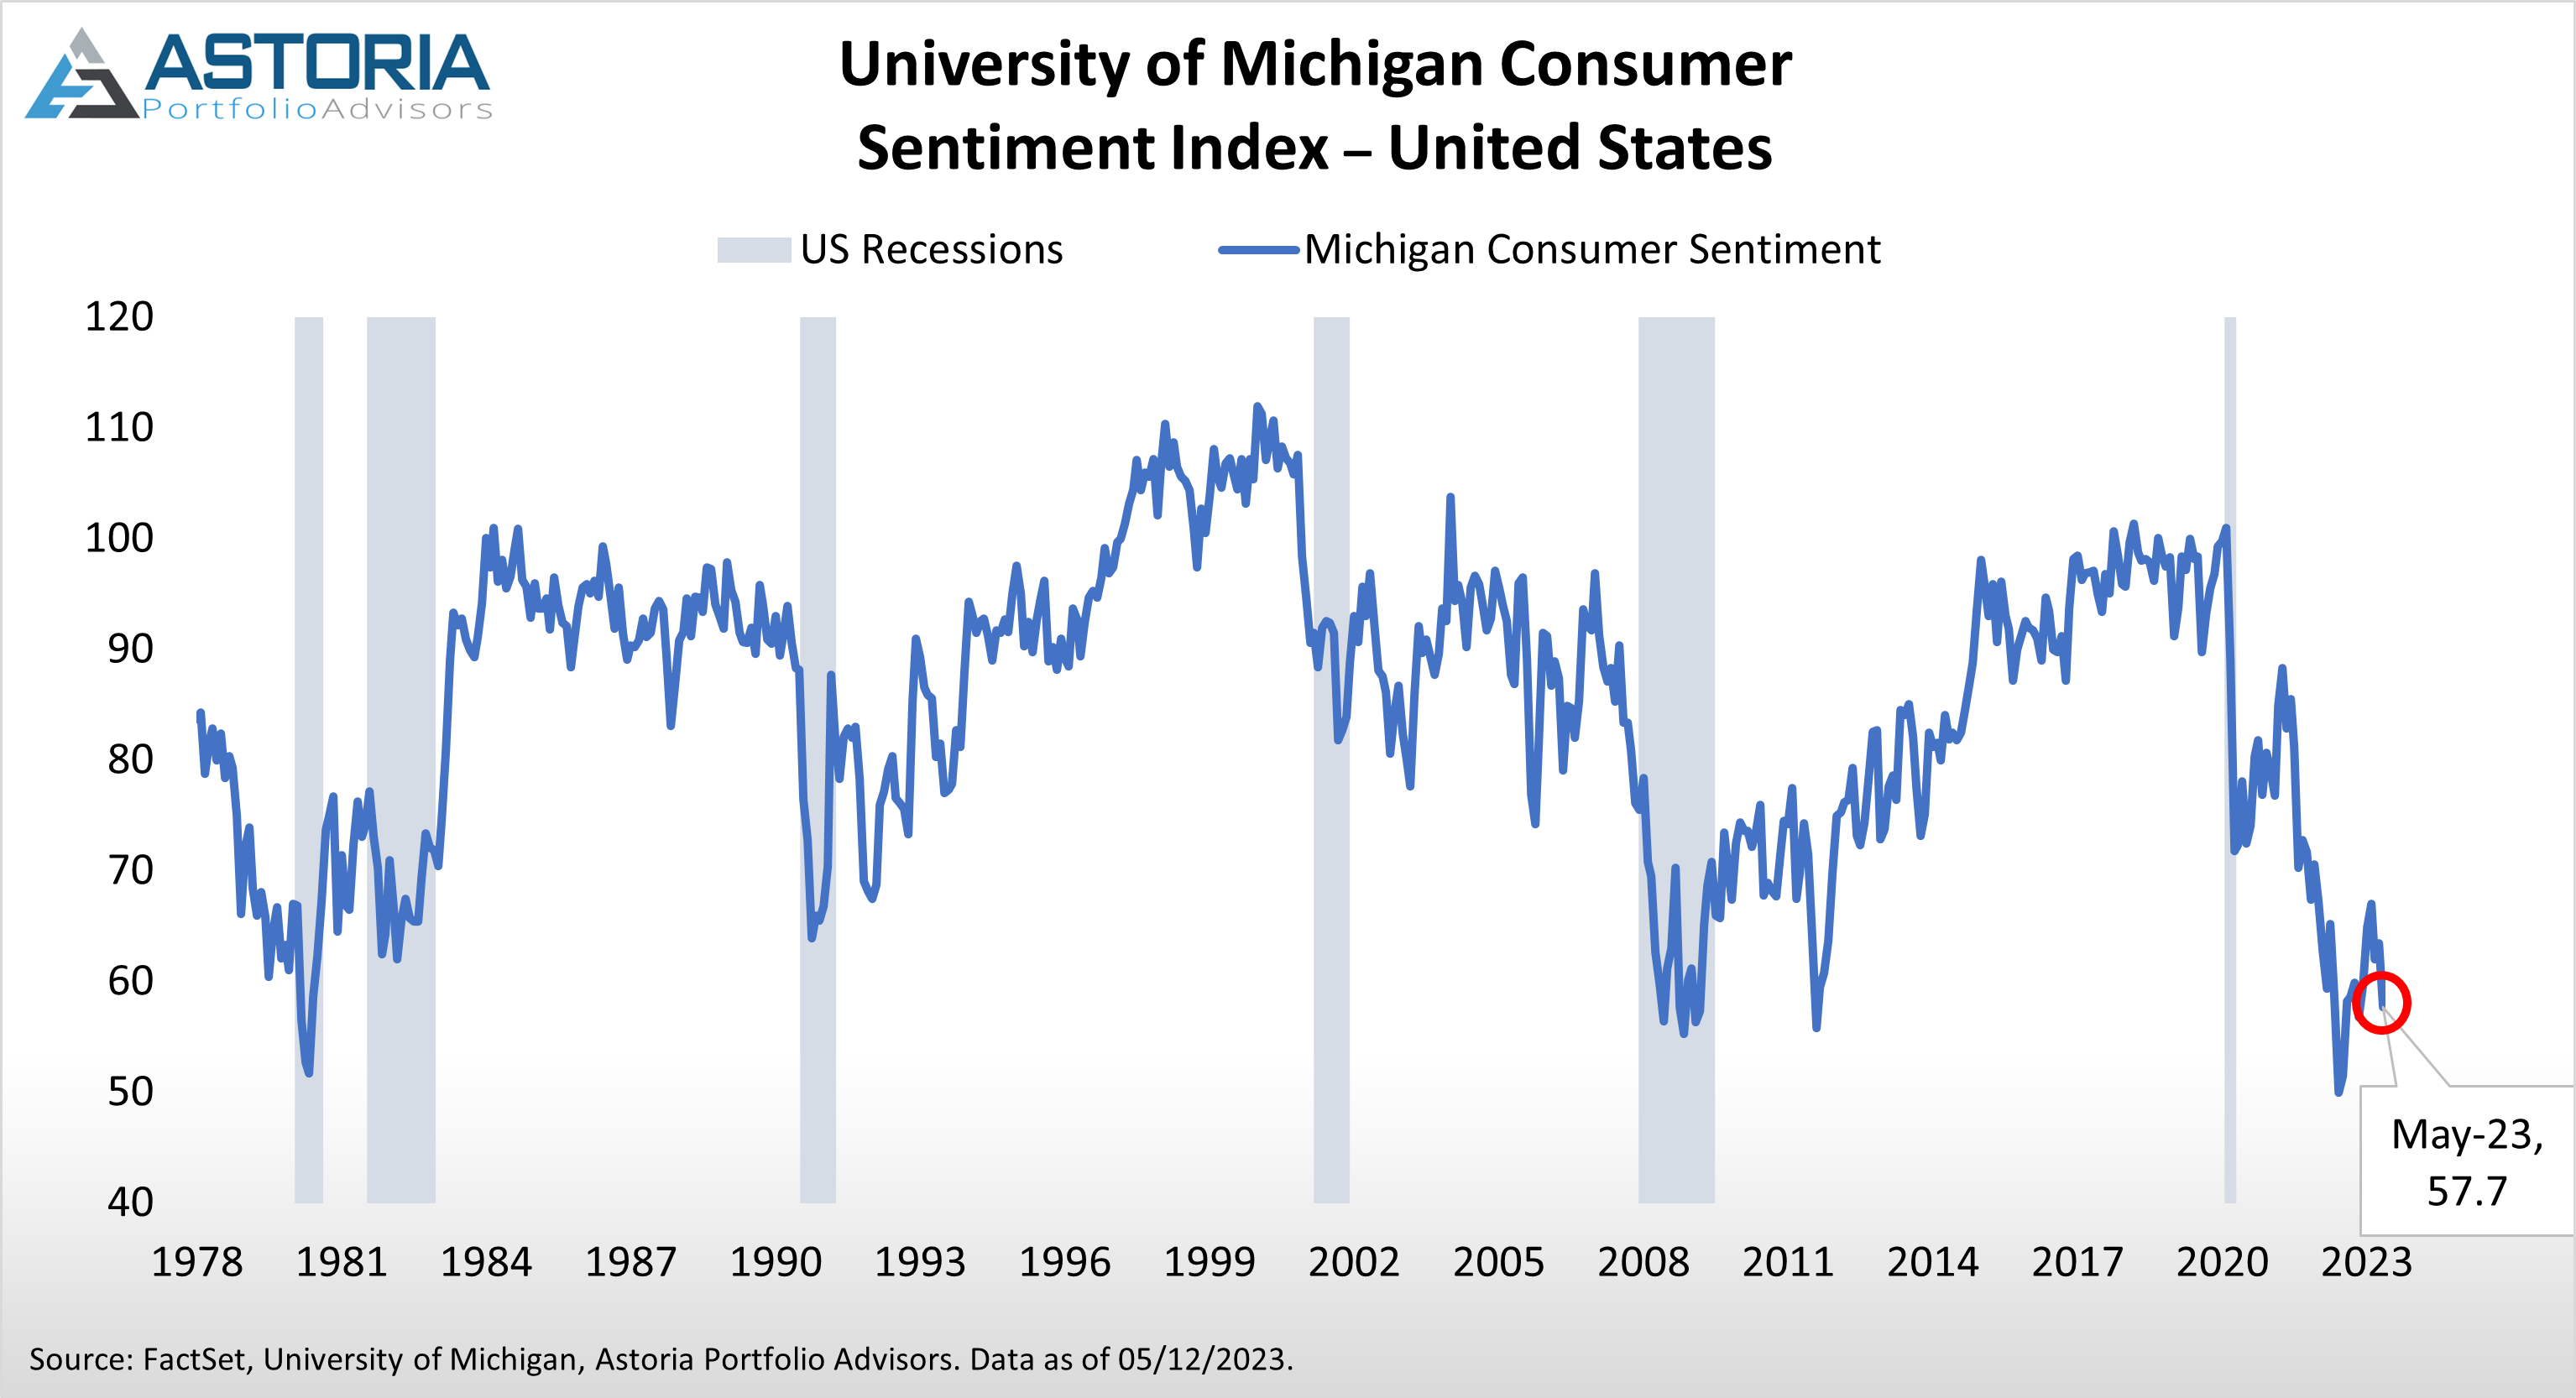
- The Michigan Consumer Sentiment Index (preliminary) printed 57.7 in May, notably missing the 63.0 estimate and down from the previous month’s 63.5. Indicates consumers’ outlook on the health of the economy has deteriorated, likely due to recession and debt ceiling worries.
-
- 1-year inflation expectations fell to 4.5% from 4.6% while 5-year inflation expectations increased to 3.2% from 3%, notching their highest level since 2011.
Earlier This Week:
- The Empire State Manufacturing Index printed -31.8 in May, largely missing the -3.5 estimate and down notably from the prior month’s 10.8 reading. Points to a greater than expected deterioration in manufacturing activity in New York amid decreasing demand. Also marks the largest monthly drop since April 2020 and its lowest level since January 2023.

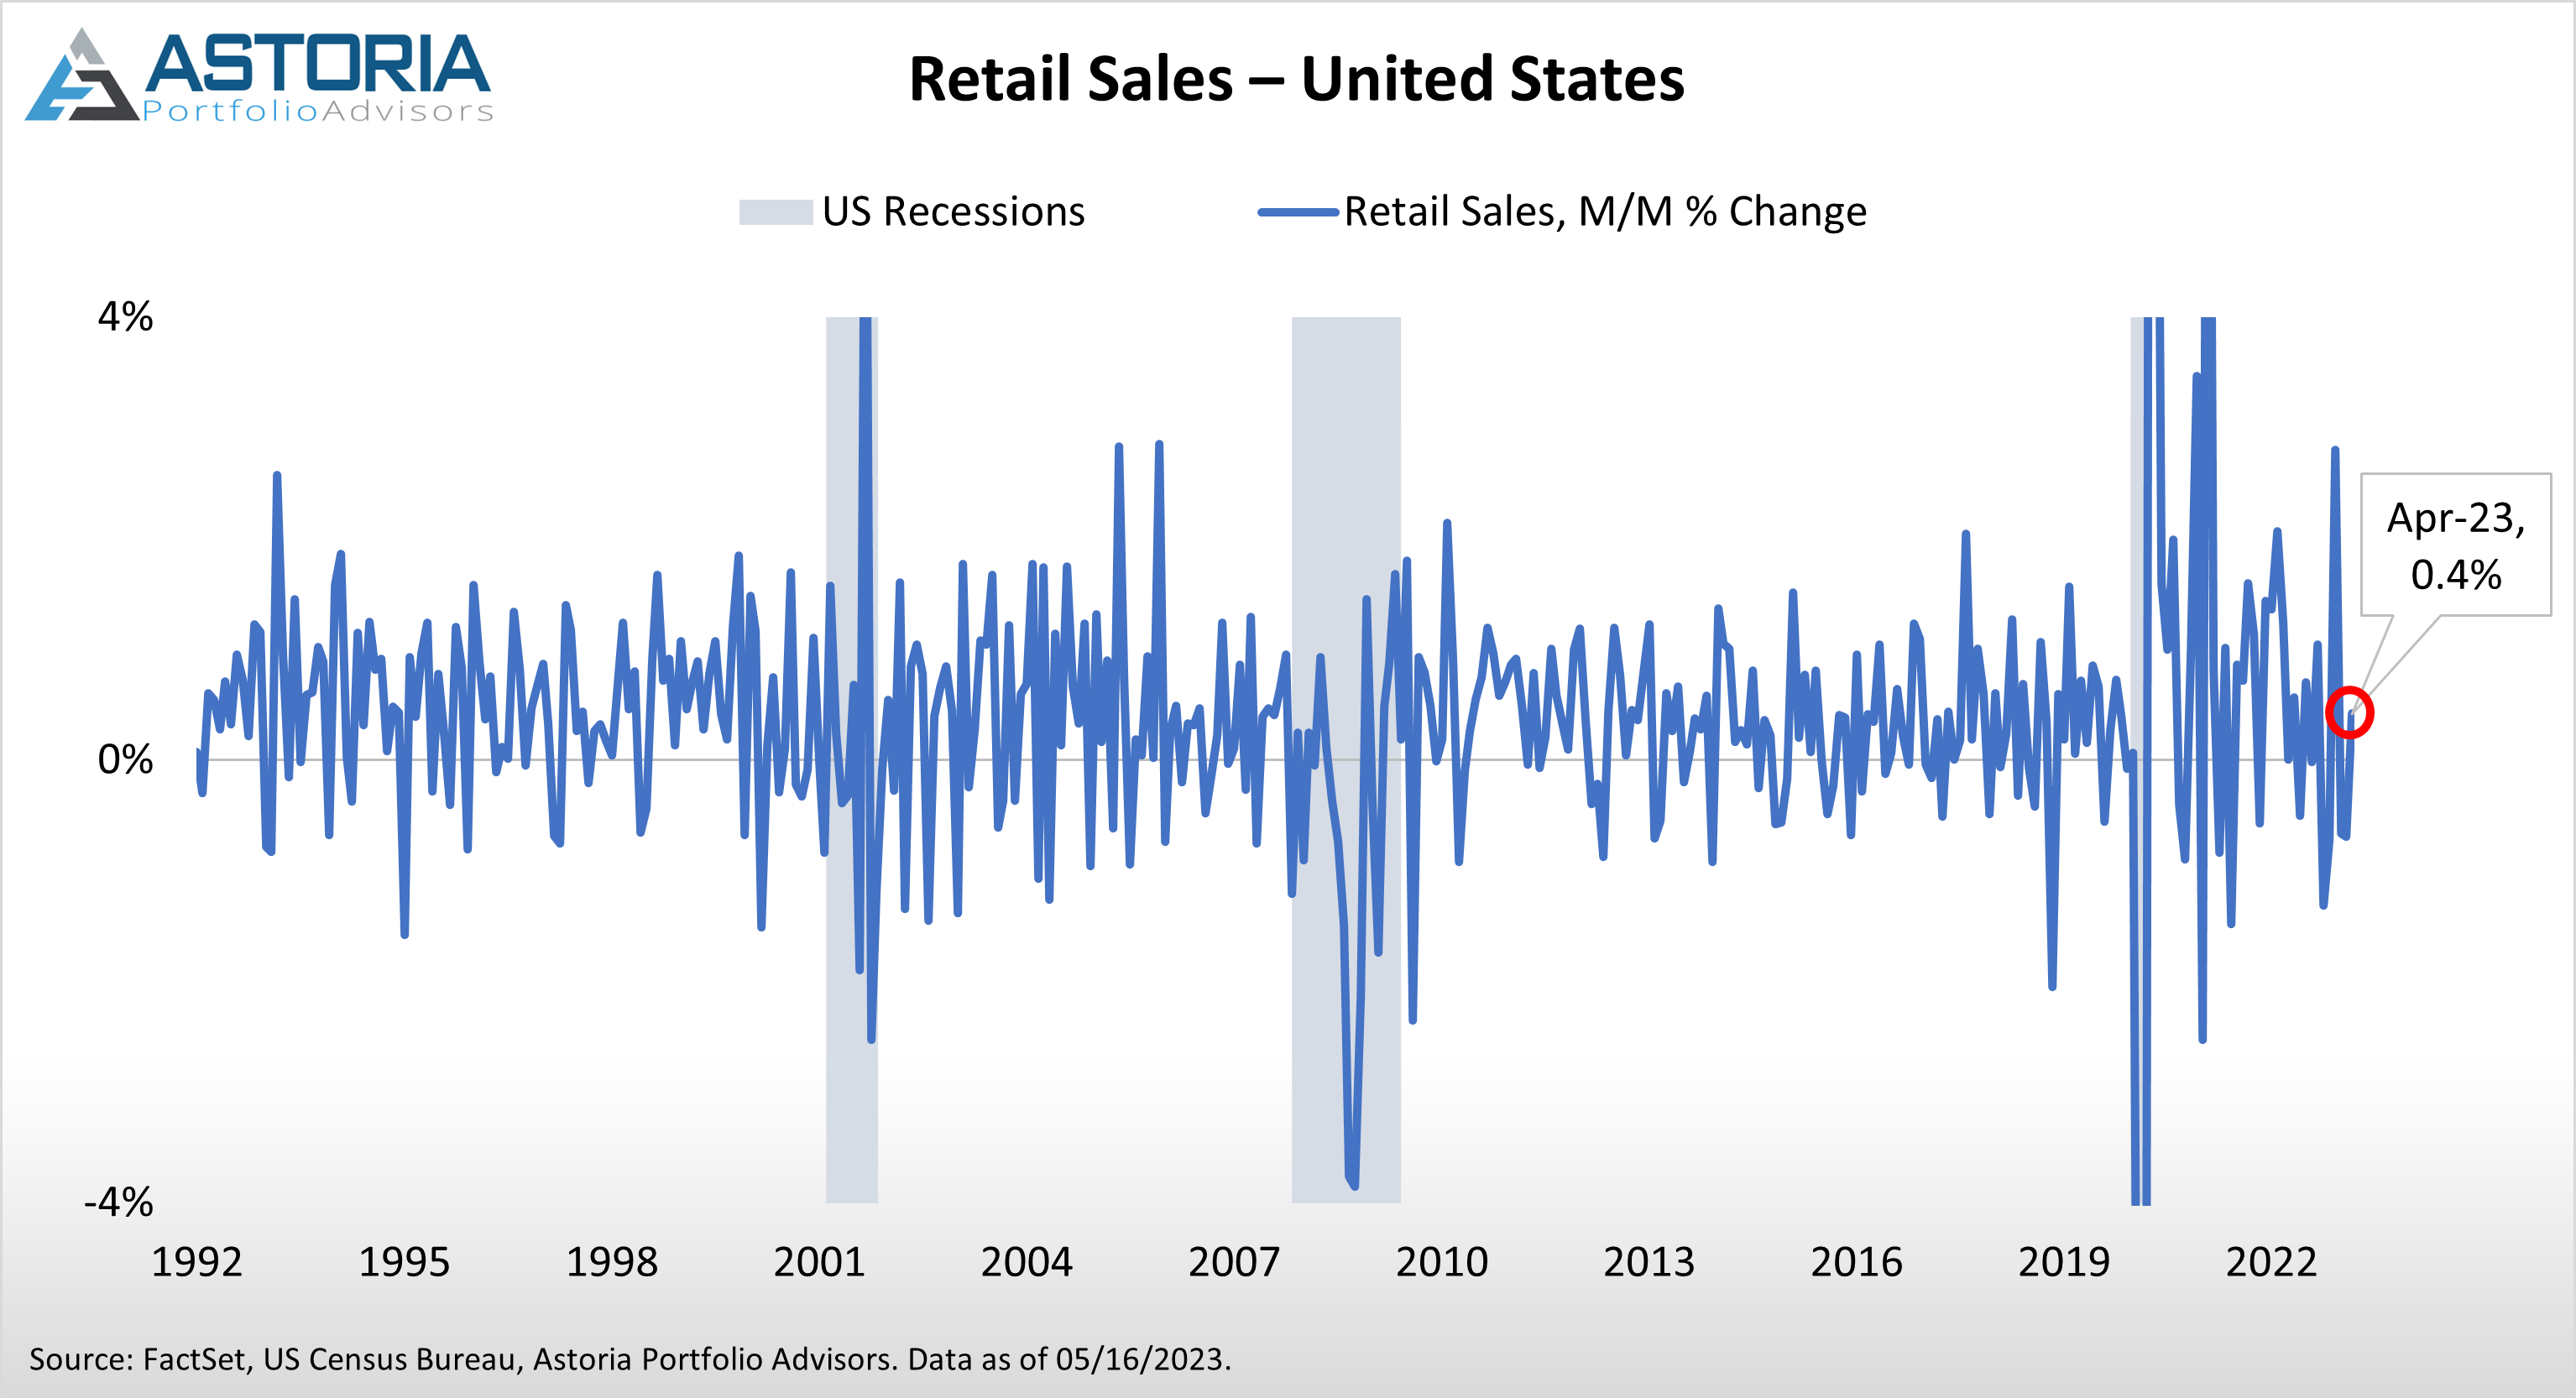
- Retail Sales rose 0.4% month over month in April, coming in short of the 0.8% consensus but up from March’s 0.7% decrease. Indicates a rebound in consumer demand and notches the first increase after two consecutive monthly declines.
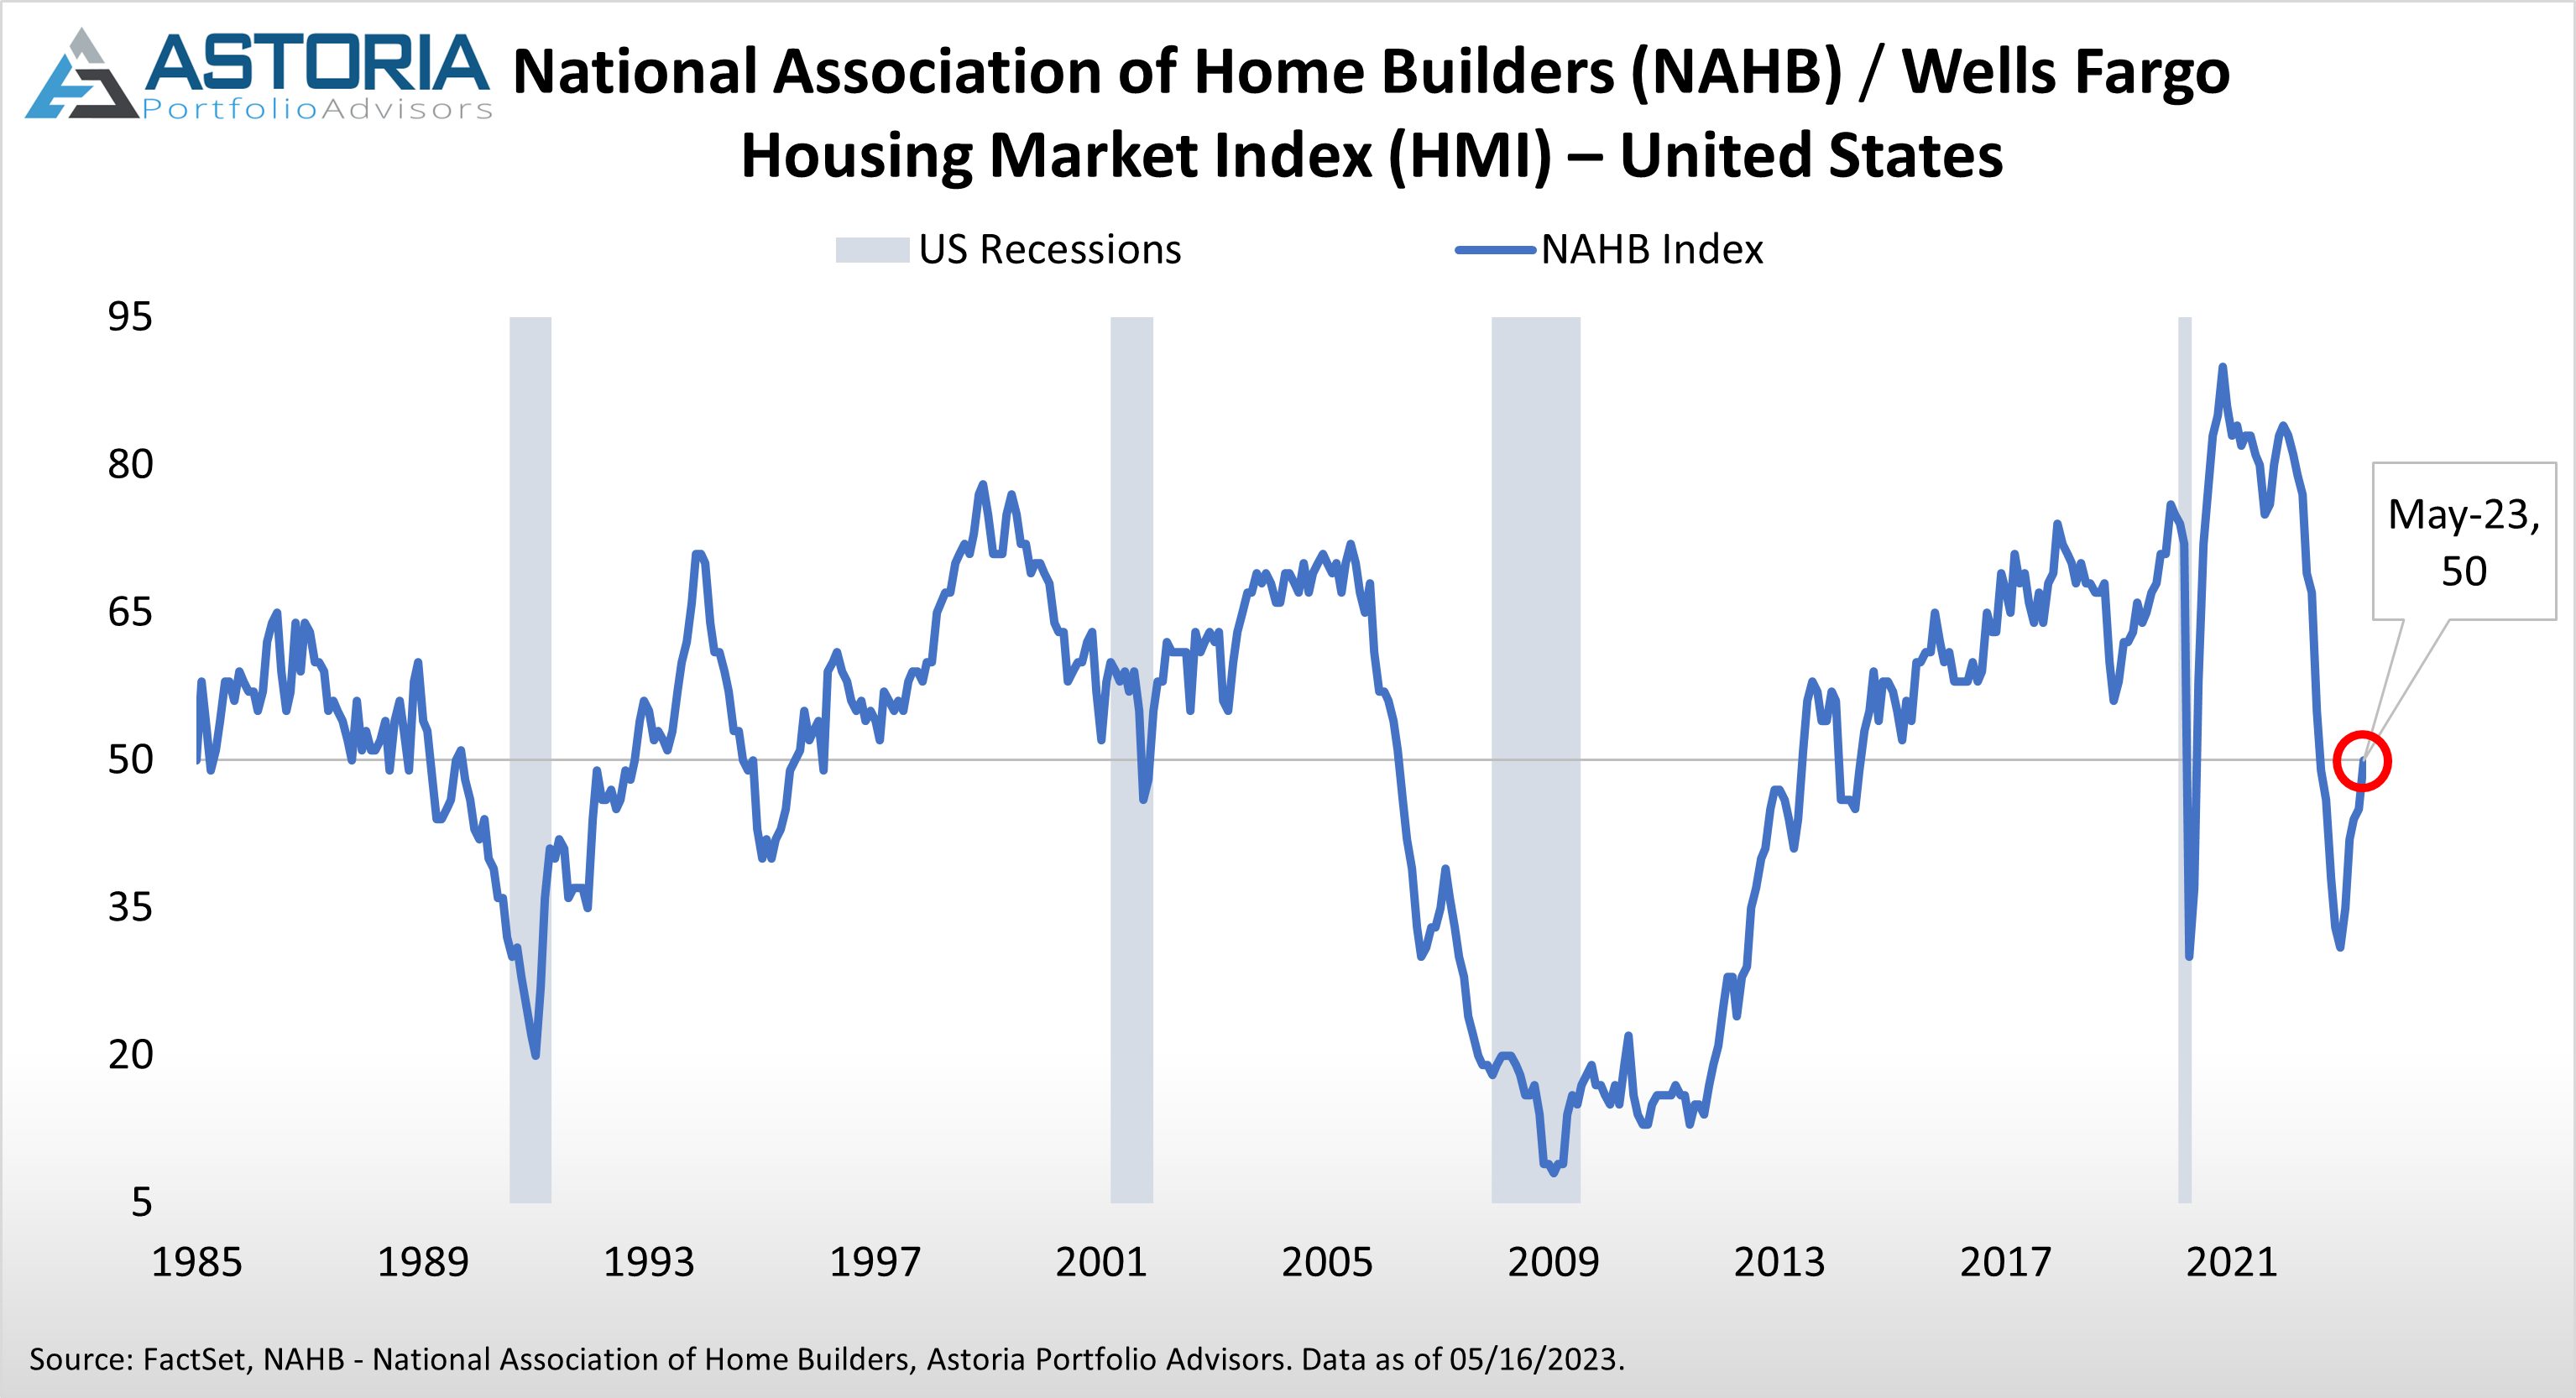
- The NAHB Housing Market Index registered 50 in May, beating the forecast of 45 and the prior month’s 45 reading. Suggests improving confidence in the housing market and marks the first print out of contractionary territory since July 2022.
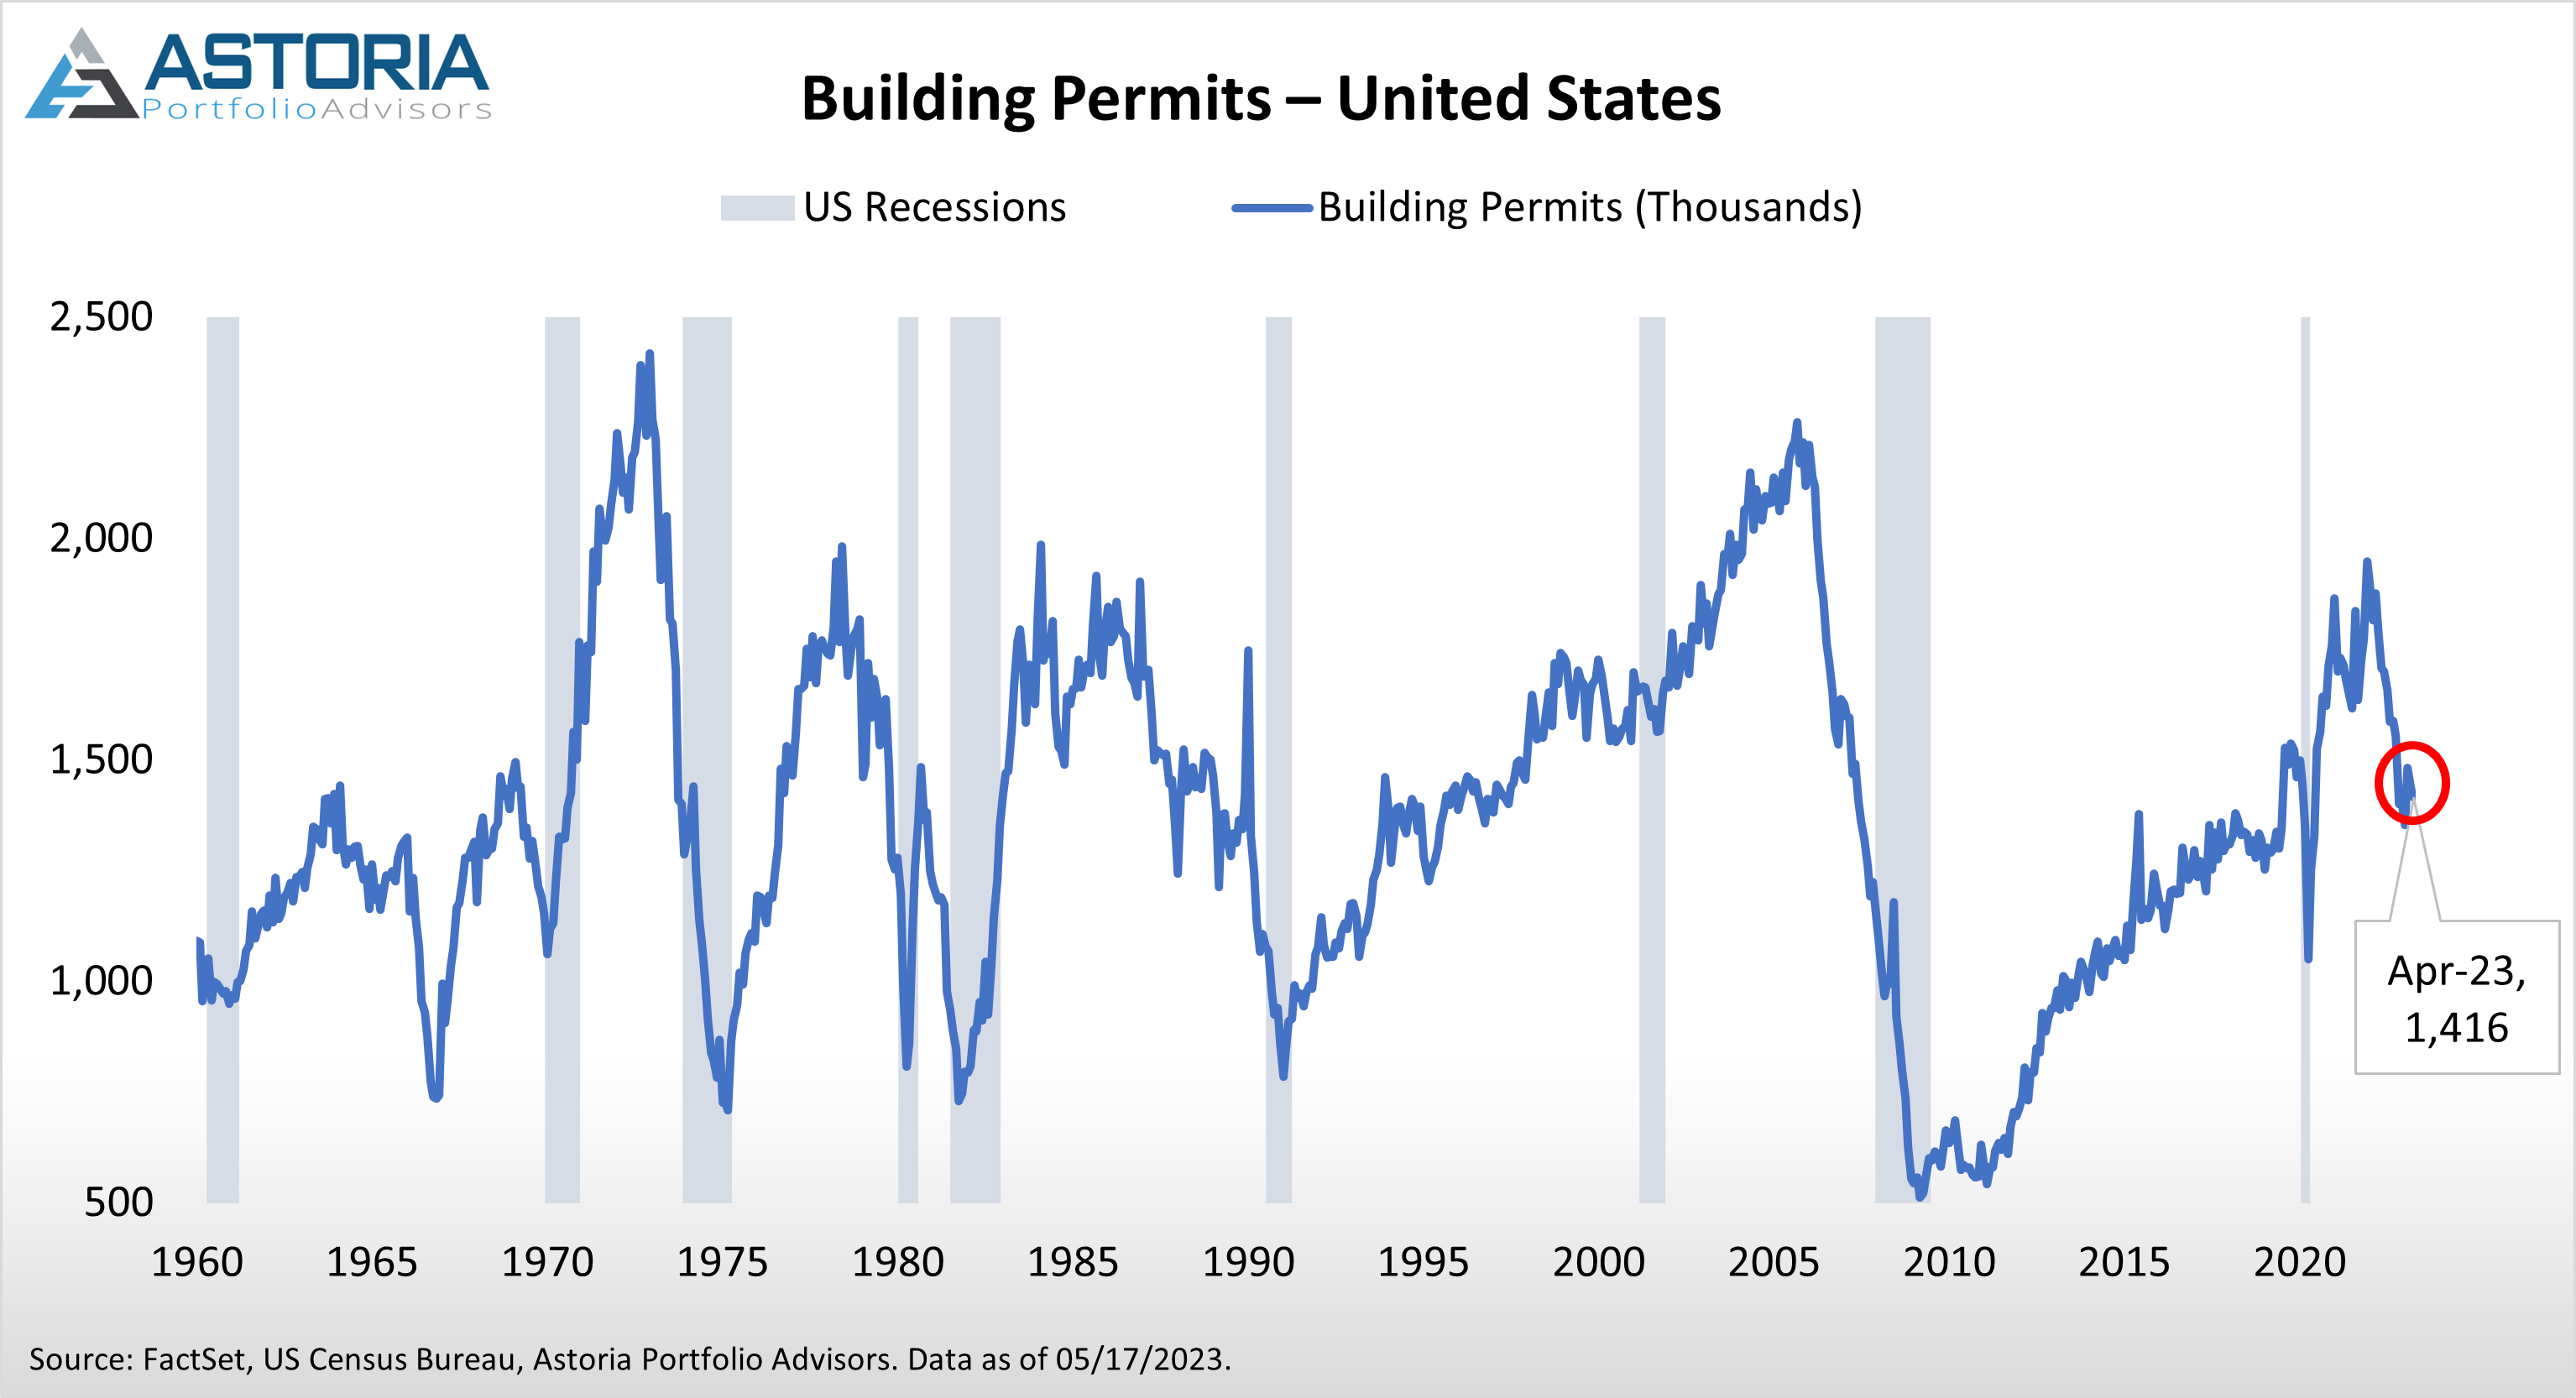
- April Building Permits (preliminary) and Housing Starts suggest mixed implications regarding the housing market. However, both readings came in close to expectations:
-
- Building Permits (preliminary) were 1,416K, just short of the 1,425K estimate but down from the previous month’s 1,437K.
-
- Housing Starts came in at 1,401K, in line with the predicted 1,400K and upwards of the prior month’s 1,371K.

Yesterday’s Update:
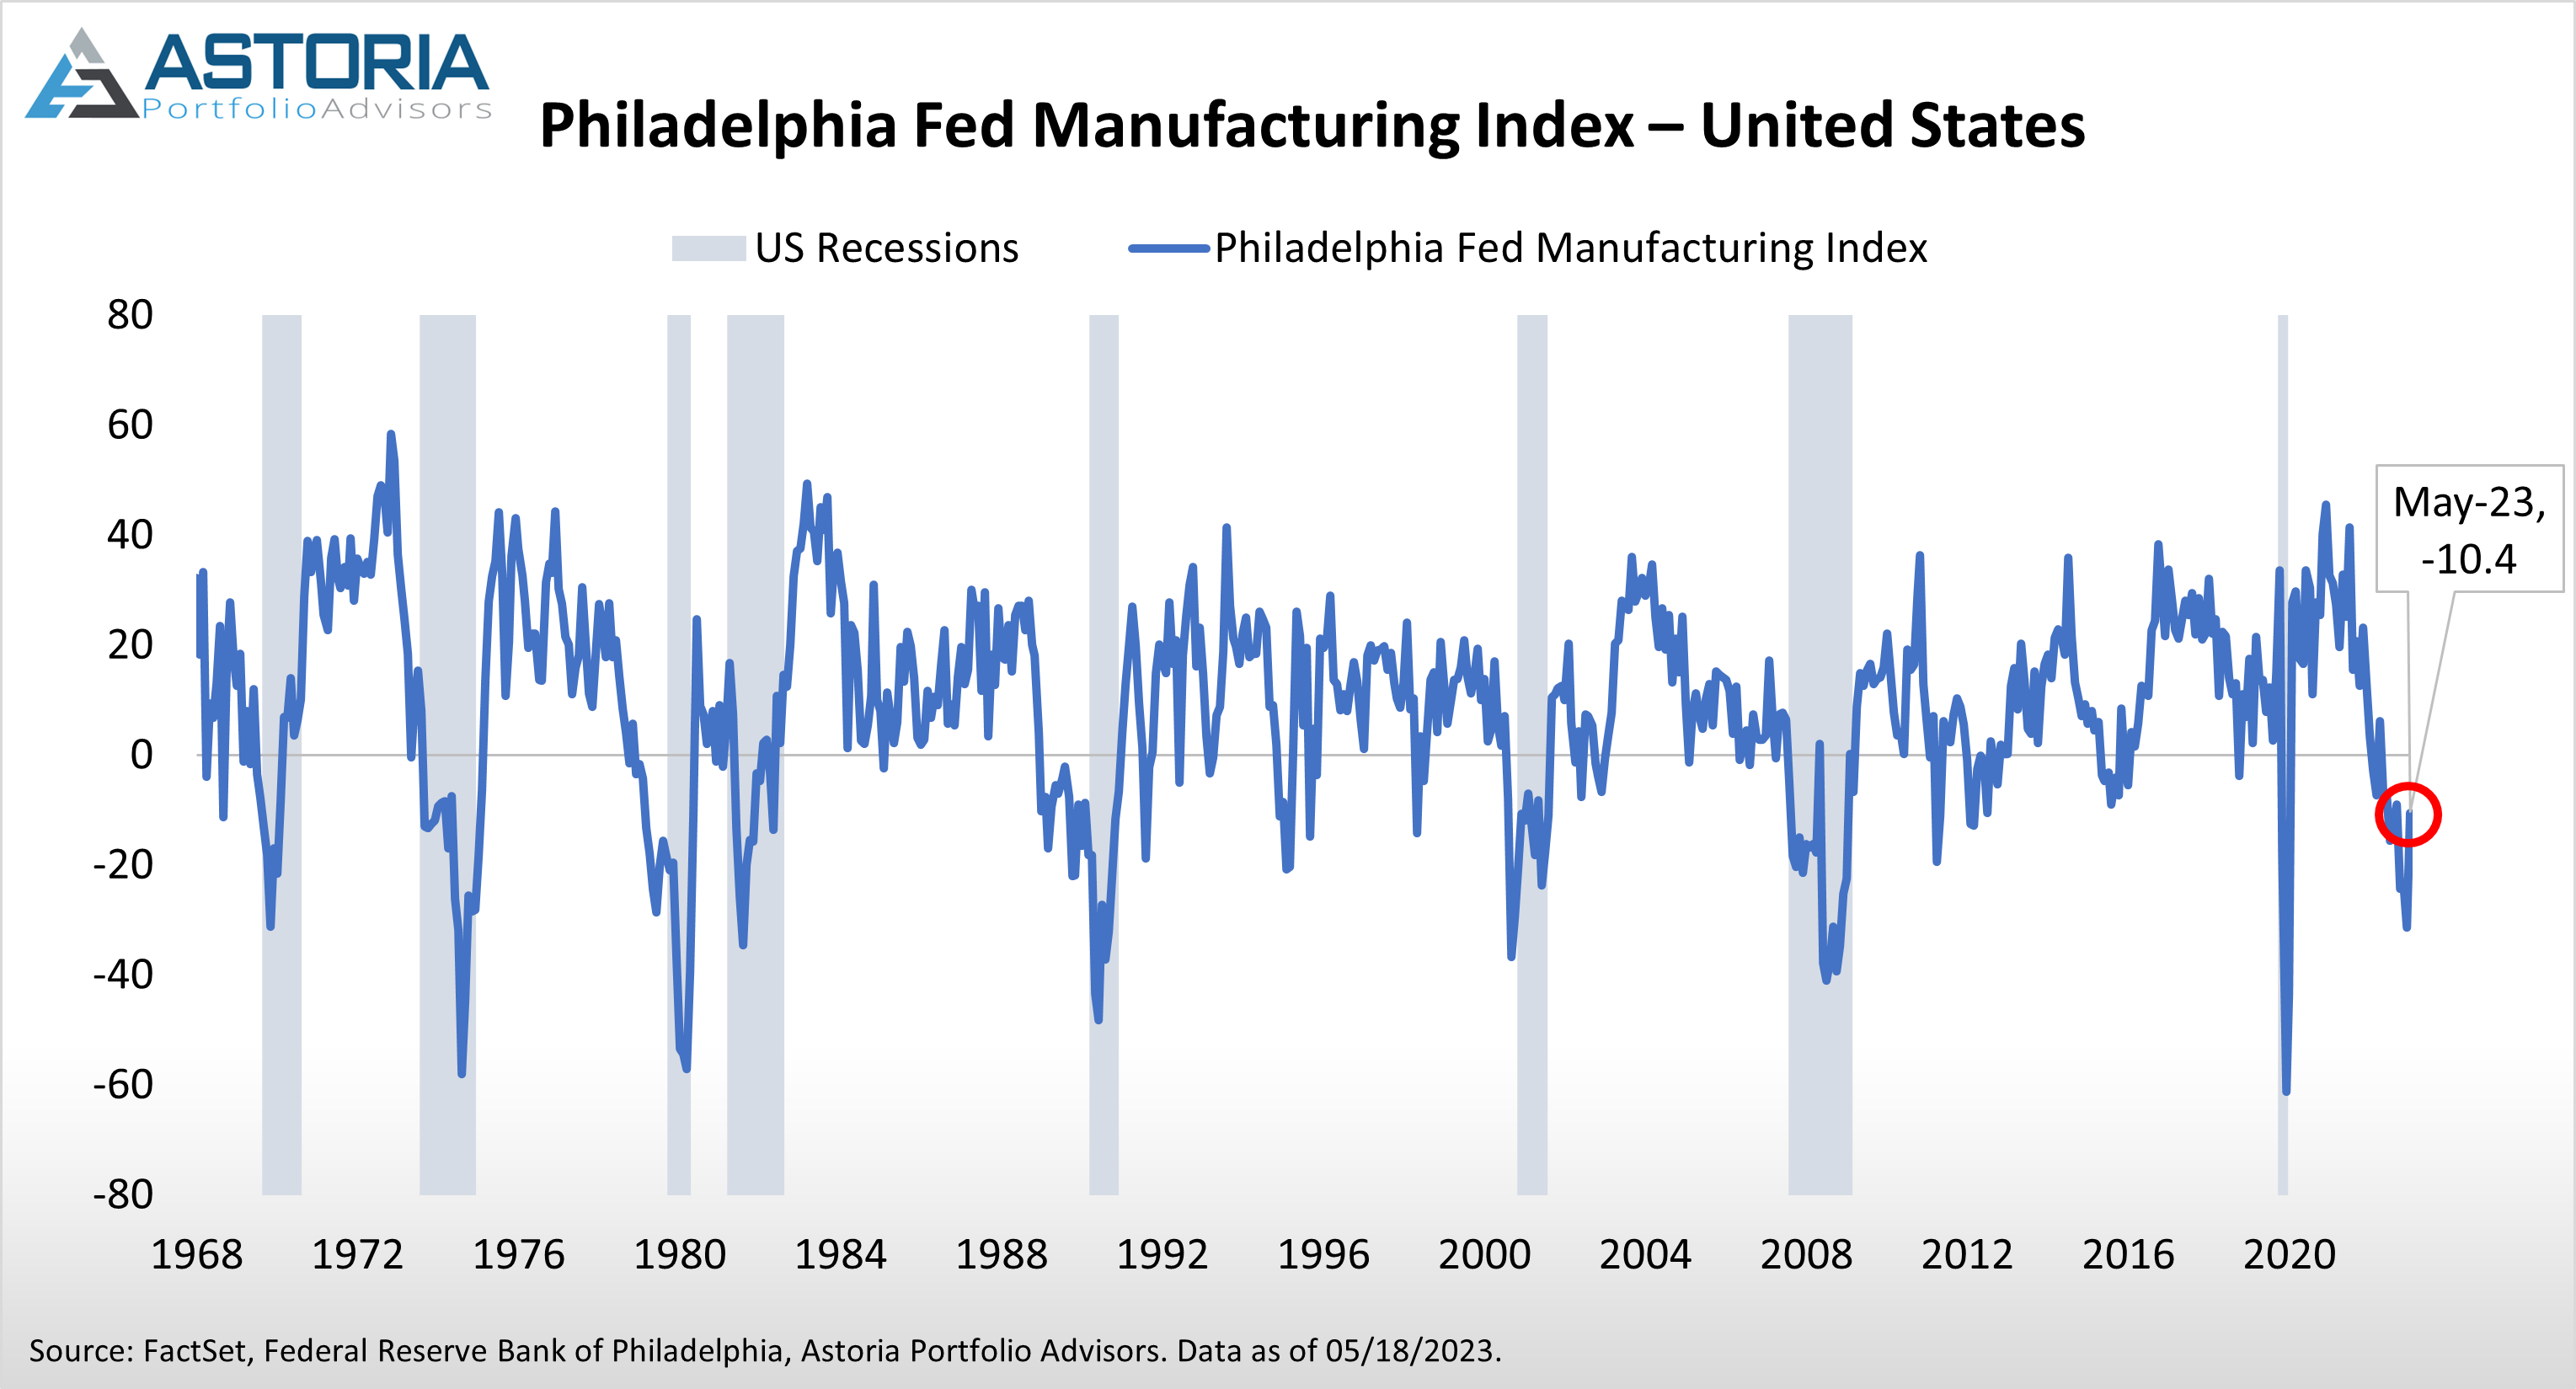
- The Philadelphia Fed Manufacturing Index registered -10.4 in May, beating the -18.5 consensus and up notably from the prior month’s -31.3 reading. Suggests business activity in Philadelphia has improved but the index still lies in negative territory.
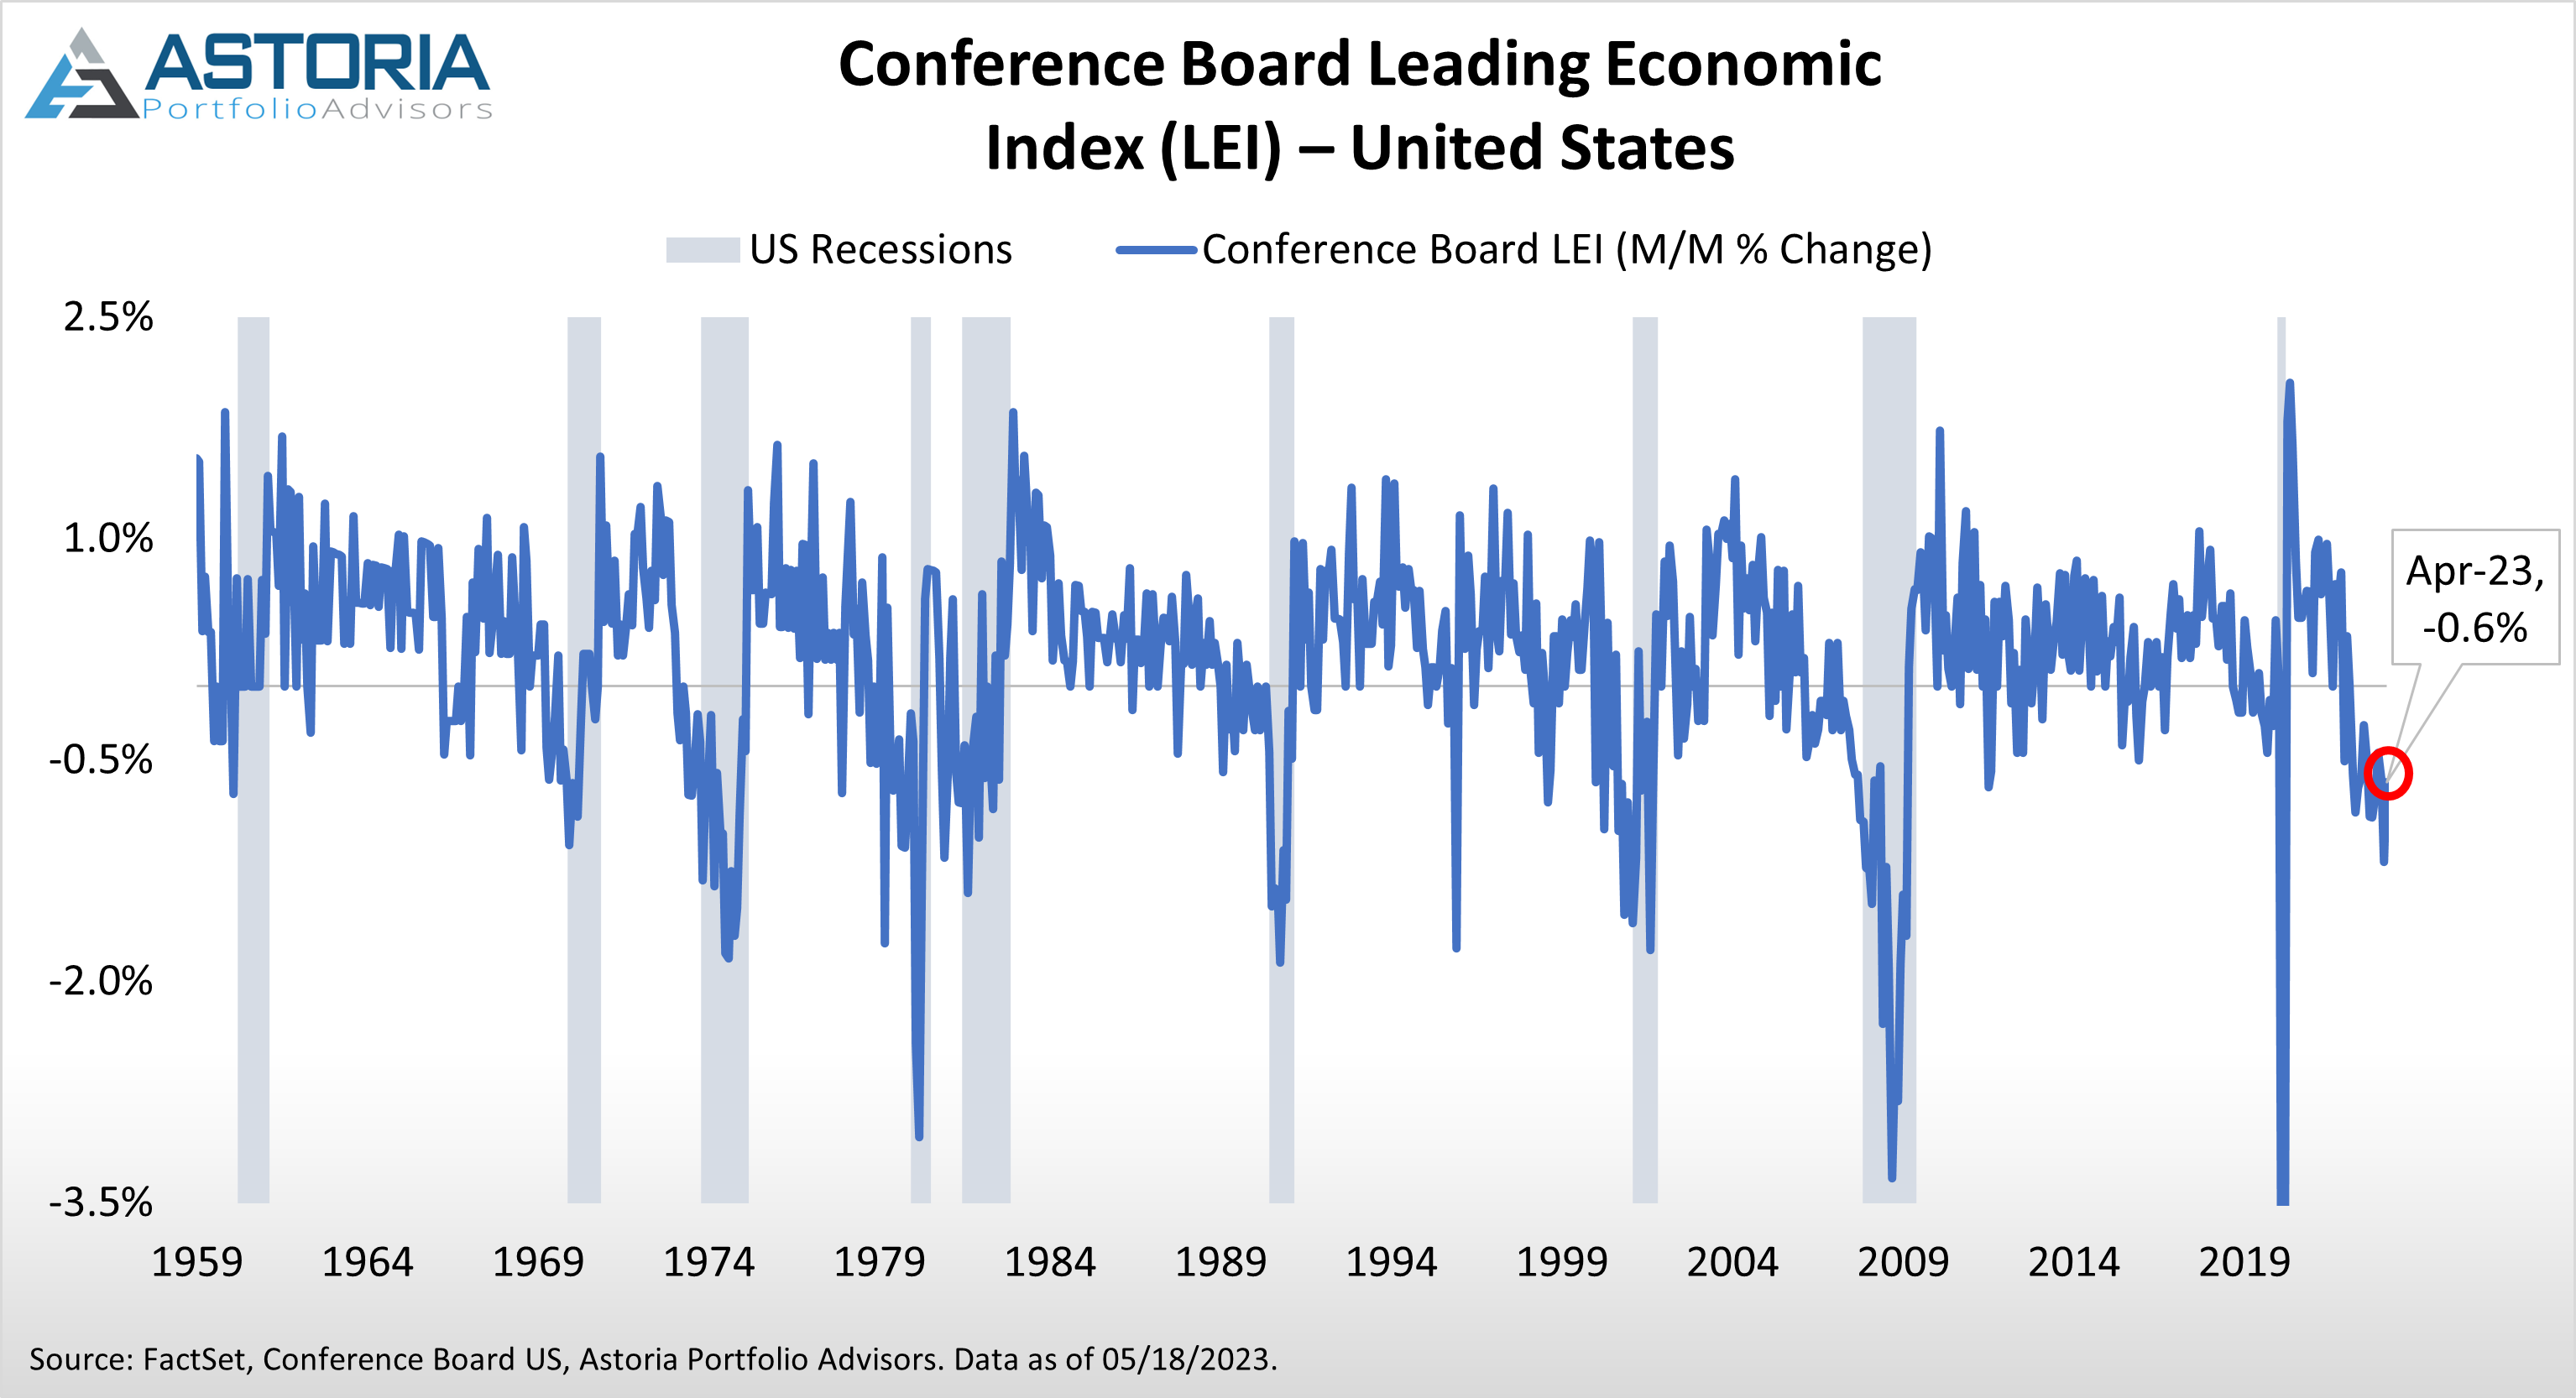
- The Conference Board Leading Economic Index declined 0.6% month over month in April, falling more than the expected 0.5% drop but less than March’s 1.2% decrease. Marks the 13th consecutive monthly decline and continues to signal a negative outlook for the economy.
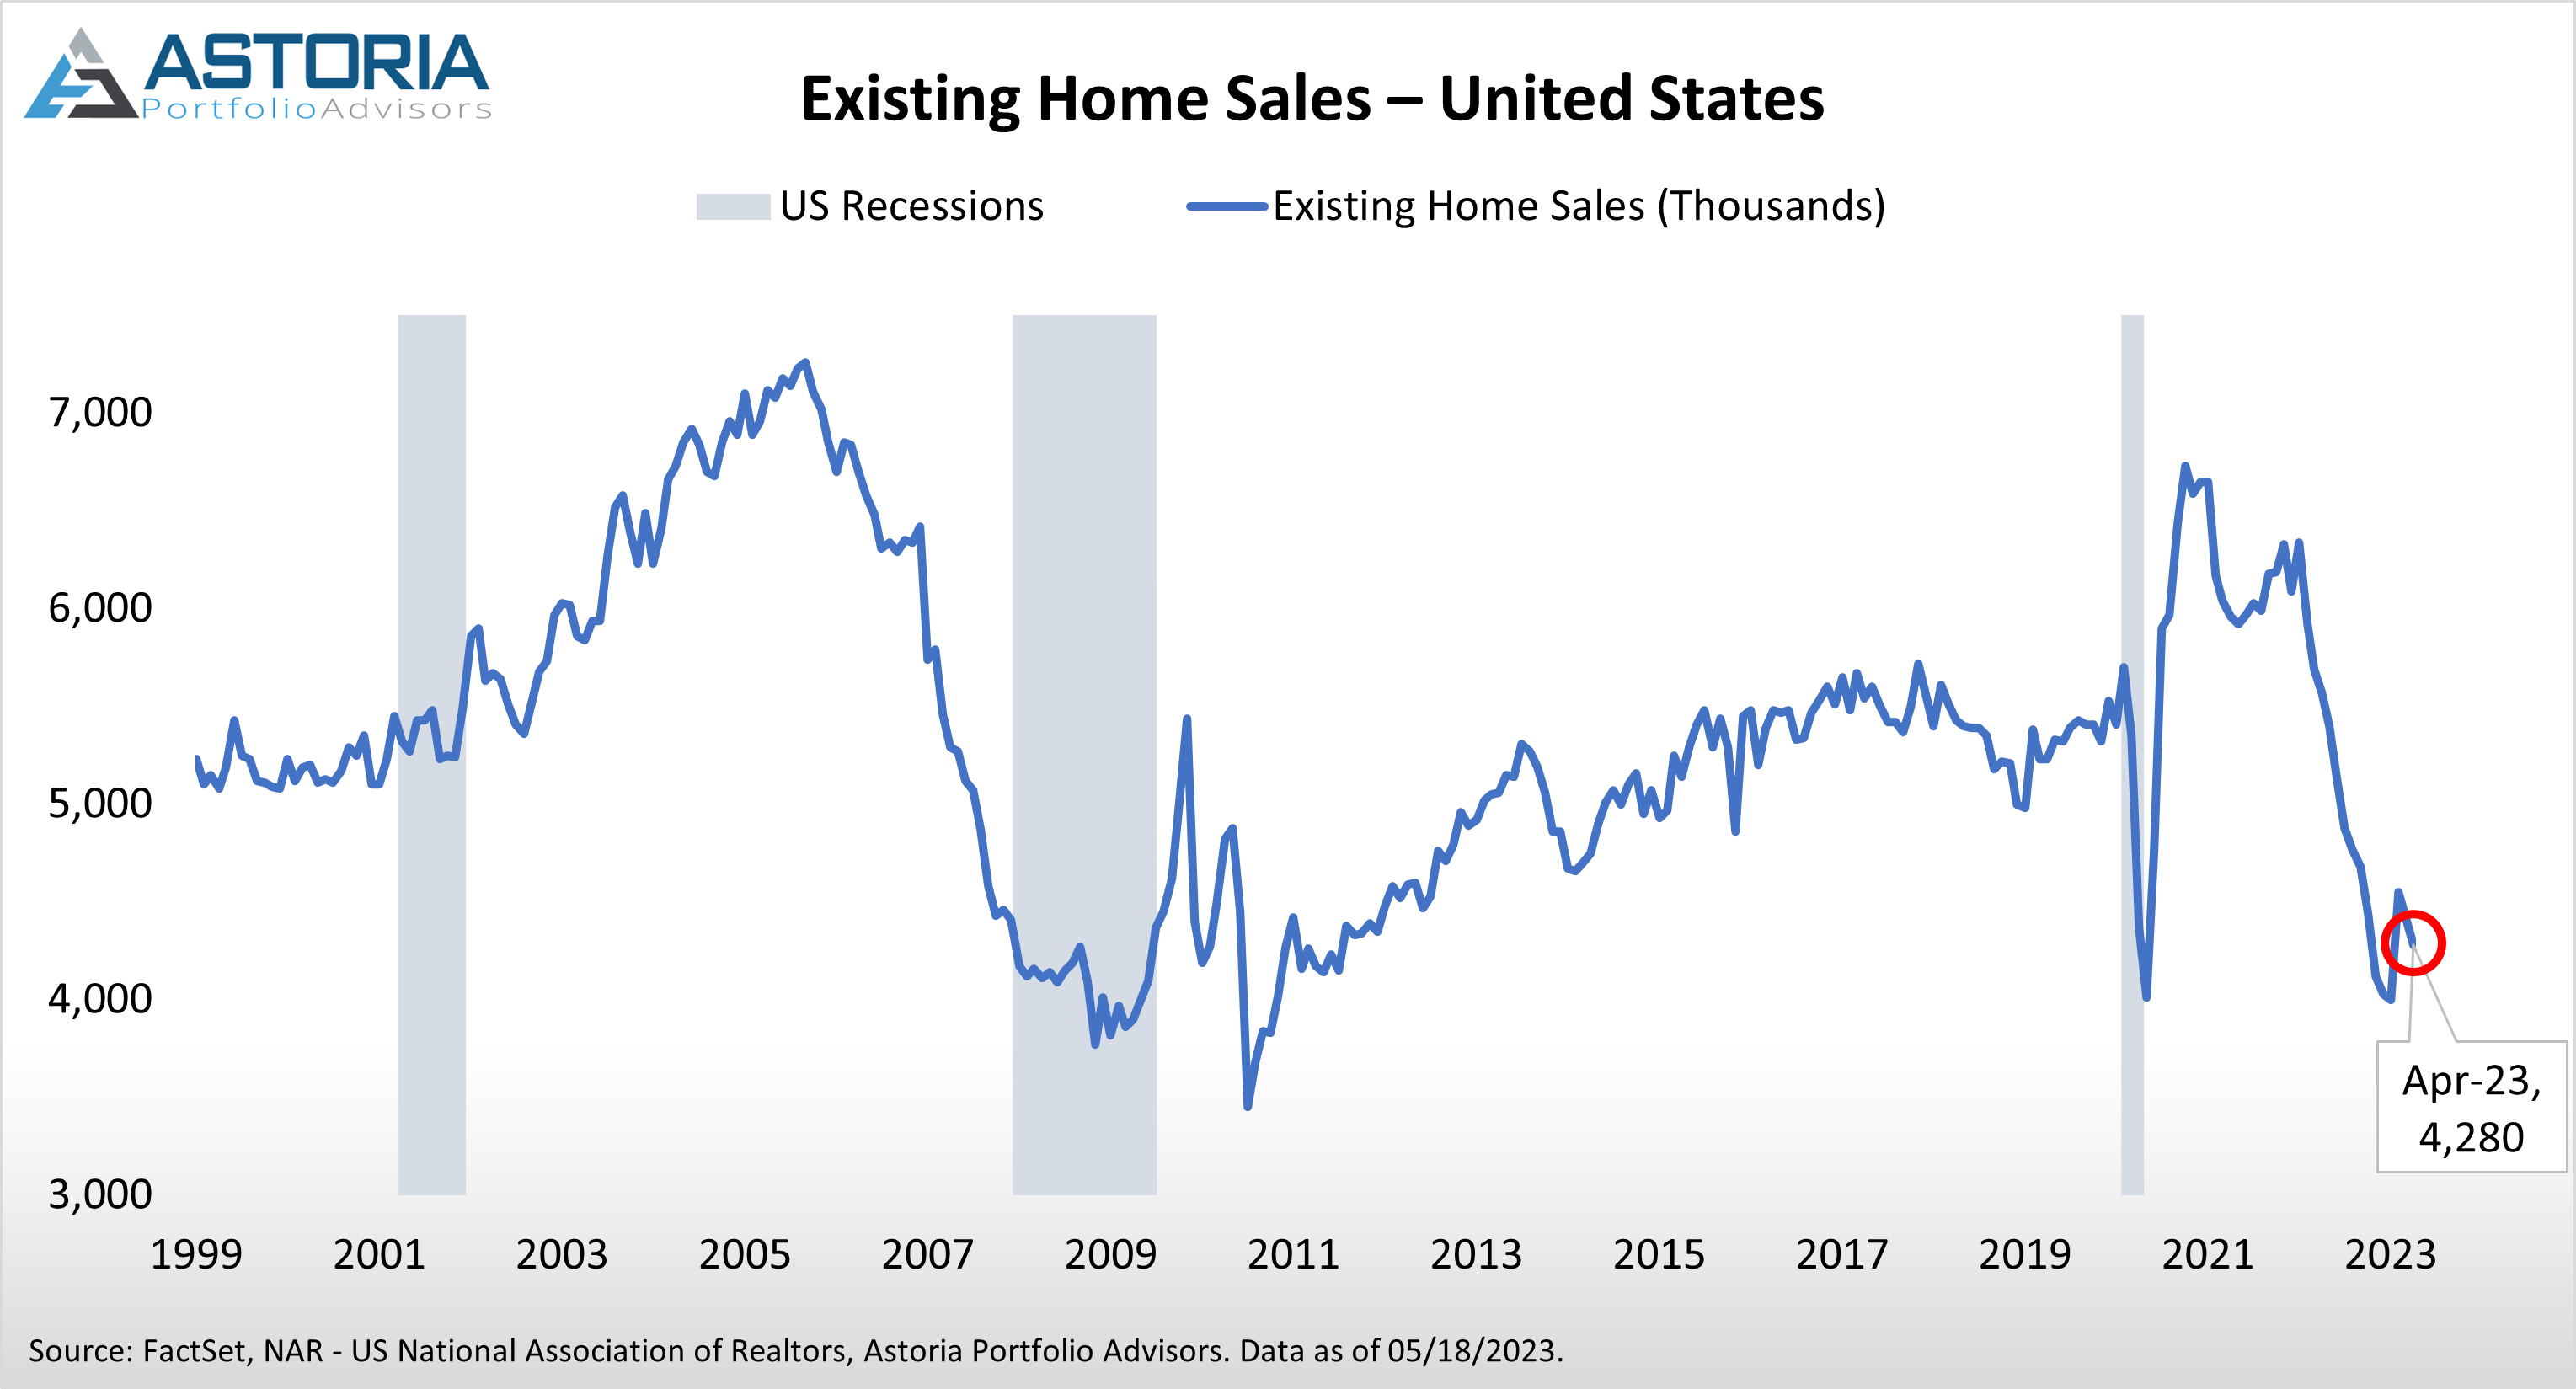
- Existing Home Sales were 4,280K in April, coming in short of the predicted 4,300K and down from the previous month’s 4,430K. Points towards more weakening in the housing market.
Additional Content:
- On May 17, 2023, US regional bank stocks via the S&P Composite 1500 Regional Banks Index saw their best daily performance since January 6, 2021. The relief comes on the back of easing bank fears as Western Alliance Bancorp, a regional bank that has been subject to recent banking turmoil, announced its quarter to date deposits grew over $2 billion, with $200 million added since last week’s update.

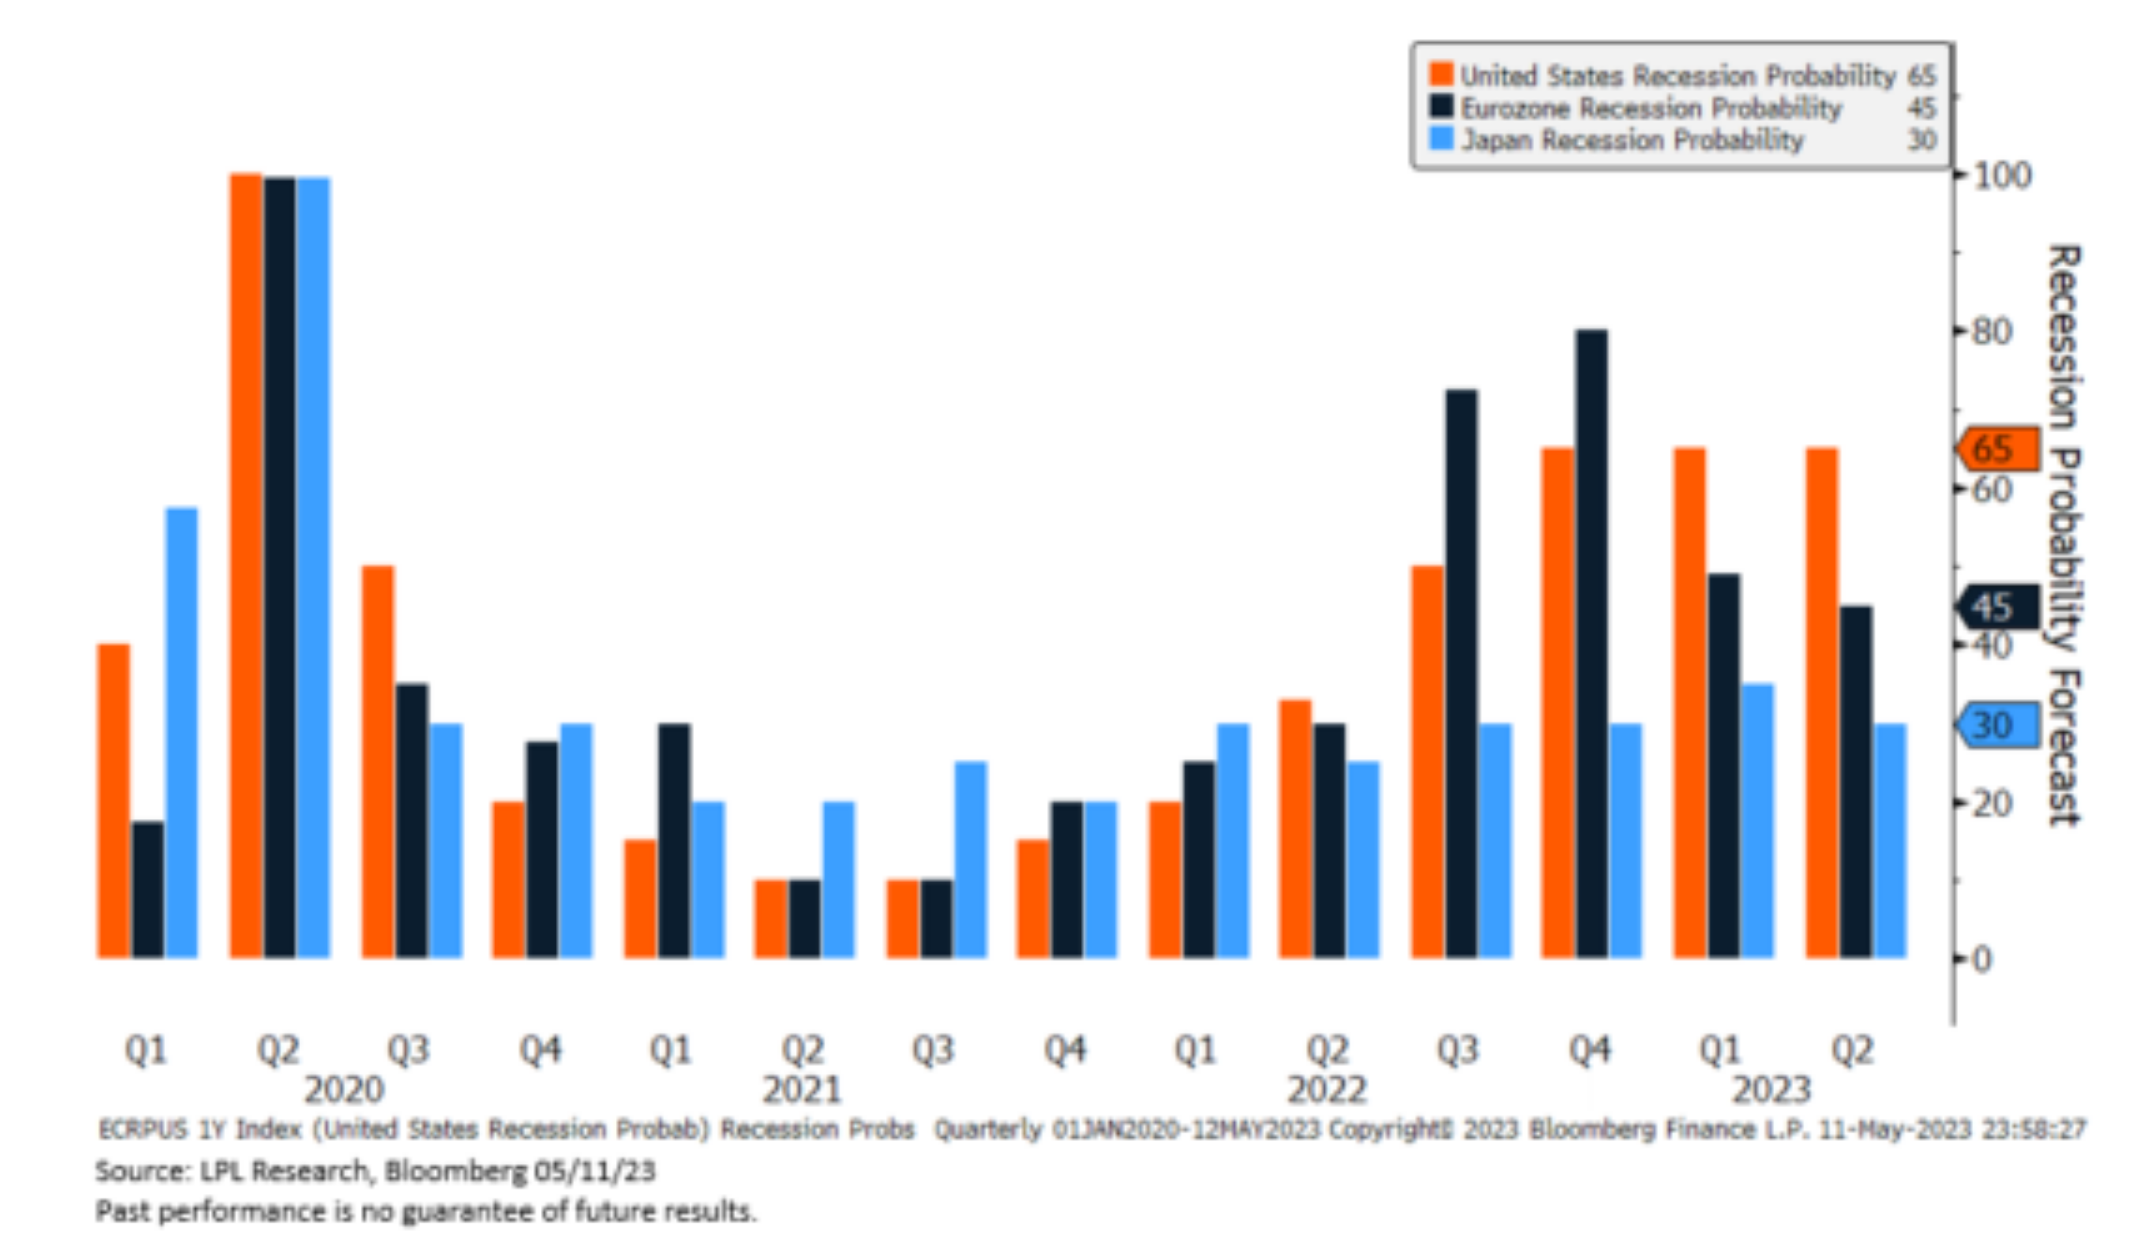
- International developed equities look attractive given MSCI EAFE Index valuations are relatively cheap compared to history. The index also trades at a twelve month forward PE ratio of 13, which is approximately five valuation turns lower than the S&P 500’s forward PE of 18. As inflation cools and the Fed may pause hiking interest rates further, the dollar is predicted to weaken which may also bode well for international developed markets. Moreover, the probabilities of the Eurozone and Japan experiencing a recession have come down in recent quarters and remain lower than that of the US based on economists’ expectations.
- How do equities perform when the Fed stops hiking? Morgan Stanley points out that it depends if inflation is elevated or not. When inflation is elevated (as it is now), the subsequent 3, 6, 9, and 12 month returns for the S&P 500 has been negative on average, ranging from -7% to -18%.

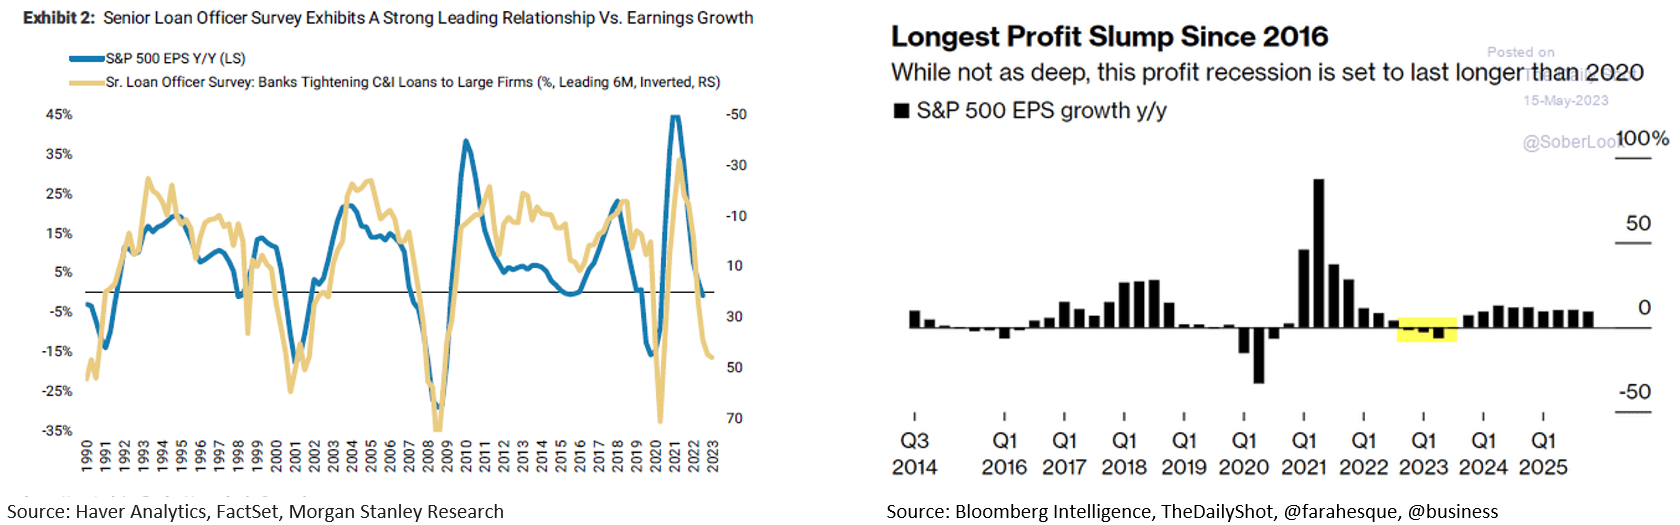
- Per Morgan Stanley, earnings growth and lending standards via the Senior Loan Officer Survey have been highly correlated. As credit conditions tighten, year over year EPS growth for the S&P 500 has historically weakened in the following quarters. Consequently, the present earnings recession is forecasted to be the longest seen since 2016 and is expected to be greater in length than the 2020 profits slump.
Best,
Nick
For more news, information, and analysis, visit the ETF Strategist Channel.
Past performance is not indicative of future performance. Any third-party websites provided on www.astoriaadvisors.com are strictly for informational purposes and for convenience. These third-party websites are publicly available and do not belong to Astoria Portfolio Advisors LLC. We do not administer the content or control it. We cannot be held liable for the accuracy, time-sensitive nature, or viability of any information shown on these sites. The material in these links is not intended to be relied upon as a forecast or investment advice by Astoria Portfolio Advisors LLC and does not constitute a recommendation, offer, or solicitation for any security or investment strategy. The appearance of such third-party material on our website does not imply our endorsement of the third-party website. We are not responsible for your use of the linked site or its content. Once you leave Astoria Portfolio Advisors LLC’s website, you will be subject to the terms of use and privacy policies of the third-party website. Refer here for more details.
Photo Source: Astoria Portfolio Advisors
