
By J. Keith Buchanan, CFA, Portfolio Manager
We know, we know. It’s the talk of the town right now. It’s the conversation starter of every late summer barbecue and grocery store checkout queue. It was August’s topic du jour. The Marshallian k.
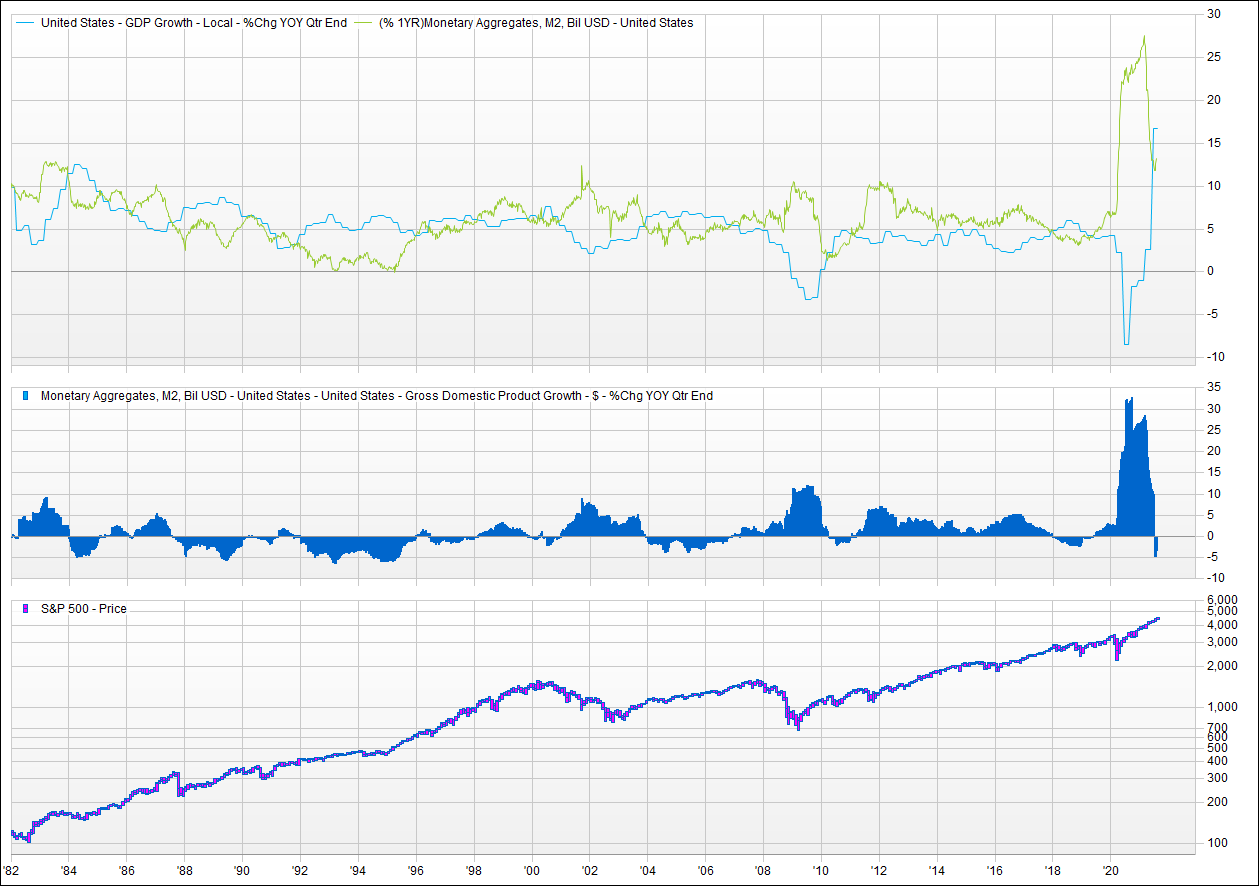
Who is Marshall and why do I care about his “k”? I may be reaching a tad, but this theory has been repeatedly pointed to in “Ah Ha!” moments of market prognosticators over the past month after having been forgotten for the past several years. Named after Alfred Marshall, one of the founding fathers of modern economics, the Marshallian k is a ratio of the supply and demand of money. The theory is neither fancy nor elaborate. Marshall applies the laws of supply and demand, which he championed for more traditional goods and services, to money. If the supply of money (in aggregate, M2) is higher than the demand for money (represented by nominal GDP), then there is “excess” liquidity that can and will find its way into asset prices. Furthermore, if the growth of money supply exceeds the growth of GDP, that excess liquidity builds, and there is more of it to find its way into more asset prices. In theory, the inverse would also hold true. If the growth of GDP exceeds the growth of money supply, then excess liquidity is being consumed by the demand for money. In this scenario, the real economy is feeding on liquidity that was once flowing into asset prices.
Source: Factset
It just keeps happening! The latter scenario has occurred in a pronounced way only a few times in recent history. It occurred in August of 1987, two months before the crash in October of that year. It happened in January of 2000, two months before the market top in March as the technology bubble crashed. It happened again at the end of 2003 as the market stalled right in the middle of the recovery.
Yet again it happened in April 2010, and the market stalled for six months, again right in the middle of the recovery. The last time Marshallian k turned negative was December 2017. It took the market the entire year of 2018 to recover after that drawn-out selloff.
It’s the liquidity, stupid. Is there something mystical about this ratio that when it turns negative, it waves a magic wand and causes markets to struggle, even when economic growth is strong? Don’t count it. Marshall himself warned future observers of the independence of money demand, supply, and prices. However, it does harken to a point we’ve been making for years now: Liquidity giveth, and liquidity taketh away. Increasing excess liquidity sets the stage for riskier assets to outperform less risky assets and creates an environment for potential significant asset mispricing. This can challenge conventional thinking (negative interest rates anyone?), cause obscure assets to become household names (looking at you, NFTs and SPACs), and bubbles to grow beyond even the wildest imagination. Declining excess liquidity makes money supply increasingly scarce and its effect can tend to be more conservative, and, in some ways, favors a more rational allocation of capital.
Since the Great Financial Crisis, central banks around the globe have shifted to more-accommodative-for-longer regimes. Quantitative easing (QE) (I, II, III, IV…pick-a-number) seems like it’s transitioning to QE Infinity. Federal Reserve monetary policy has erred on the side of dovishness with very low rates and quantitative easing supplementing GDP growth which, nonetheless, has grown more and more anemic.
Macroeconomic musical chairs, anyone? Which brings us to the proverbial question that keeps us up at night– How does it all end? Money supply growth is already shrinking and consensus is building that tapering back asset purchases at the Federal Reserve is months, not years, away. Meanwhile, as the chart illustrates, the market has demonstrated an uneasiness when monetary policy becomes restrictive while economic growth is buoyant. All this time, market participants have been worried about what happens when the punchbowl gets pulled away. Can the economic recovery and expansion wean itself off the flood of liquidity thrown at the markets during the pandemic?
Something’s gotta give. These concerns help to inform our view that something dramatic and substantive has to change in order for 2022 to become a better economic and investing environment than 2019. Granted, the modern US economy has never amassed excess liquidity as quickly and with such magnitude as it did in the first half of 2020. In other words, the pool of excess liquidity has never been larger so, perhaps, asset prices should be able to withstand the enormous pool of excess liquidity being drawn in by a small amount. However, that liquidity did not collect on the sidelines. Equity valuations and bond prices are at historical highs. A drawdown of liquidity of any size or duration threatens asset prices which have heretofore been its beneficiary.
The upshot? Liquidity measures, including Marshallian k, are showing signs of moving in a less positive direction, adding a concerning headwind to a seemingly vulnerable market.
GLOBALT is an SEC Registered Investment Adviser since 1991 and, effective July 10, 2013, remains a Registered Investment Adviser through a separately identifiable division of Synovus Trust N.A., a nationally chartered trust company. This information has been prepared for educational purposes only, as general information and should not be considered a solicitation for the purchase or sale of any security. This does not constitute legal or professional advice, and is not tailored to the investment needs of any specific investor. Registration of an investment adviser does not imply any certain level of skill or training. Due to rapidly changing market conditions and the complexity of investment decisions, supplemental information may be required to make informed investment decisions, based on your individual investment objectives and suitability specifications. Investors should seek tailored advice and should understand that statements regarding future prospects of the financial market may not be realized, as past performance does not guarantee and/or is not indicative of future results. Content may not be reproduced, distributed, or transmitted in whole or in part by any means without written permission from GLOBALT. Regarding permission, as well as to receive a copy of GLOBALT’s Form ADV Part 2 and Part 3, contact GLOBALT’s Chief Compliance Officer, 3400 Overton Park Drive, Suite 200, Atlanta GA 30339. You can obtain more information about GLOBALT Investments and its advisers by accessing the Investment Advisor Public Disclosure website.
The opinions and some comments contained herein reflect the judgment of the author, as of the date noted.
Investment products and services provided are offered through Synovus Securities, Inc. (SSI), a registered Broker-Dealer, member FINRA/SIPC and SEC Registered Investment Adviser, Synovus Trust Company, N.A. (STC), Creative Financial Group, a division of SSI. Trust services for Synovus are provided by STC.
Regarding the products and services provided by GLOBALT:
NOT A DEPOSIT. NOT FDIC INSURED. NOT GUARANTEED BY THE BANK. MAY LOSE VALUE. NOT INSURED BY ANY FEDERAL AGENCY
