
By Adam Grossman, CFA, Riverfront Investment Group
SUMMARY
- Despite high current valuations we believe neither the Nasdaq nor the Dow is in a bubble; both are positioned to grow into their valuations based on strong expected earnings.
- We believe both index styles (Growth for Nasdaq and Value for Dow) will do better than fixed income over the next few years.
- Comparing the two indices, given our view of a strong economic recovery combined with an accommodative fed, we favor the cheaper Dow companies over the more expensive Nasdaq.
We now favor Blue Chip stocks over Growth stocks
Our view of the macro economy and the market favors Blue Chip stocks, like those that make-up the Dow Jones Industrial Average, over Growth stocks that dominate the Nasdaq-100. A consistent message from RiverFront has been the migration from Growth-oriented themes to Value-oriented themes, and this analysis hopefully explains some of the underpinnings. (See our 12.14.2020 Weekly View: The Growth vs Value Debate)
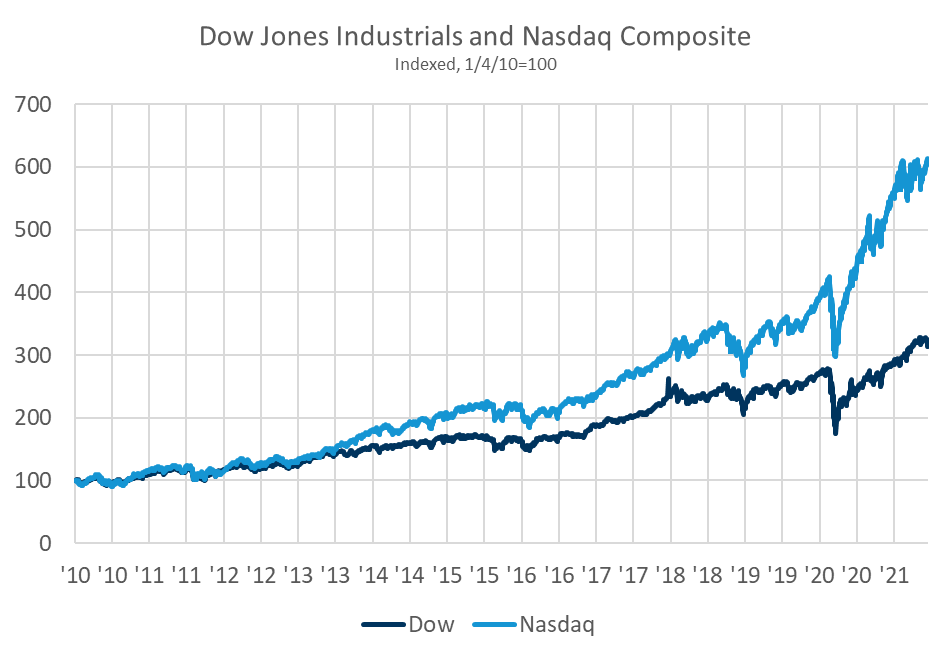
Past performance is no guarantee of future results. Shown for illustrative purposes. Not indicative of RiverFront portfolio performance. Index definitions are available in the disclosures.
We are reminded of the battle between Ford and Ferrari to win the Le Mans car race in the 1960s. In our mind the Dow (more traditional and value-oriented) reminds us of Ford, and the more growth-oriented Nasdaq of Ferrari. We briefly explain how each index is put together, their historic performance and the drivers of that performance. Despite high current valuations, neither the Nasdaq nor the Dow is in a bubble, in our view, because we believe the huge rebound in earnings after COVID-19 will allow them to ‘grow into their valuations’. However, we think the expectations of continued fast growth in the Nasdaq may be too high, whereas we think the Dow will positively surprise investors, just as Ford did when it won the race in 1966.
Composition and historical performance of each index:
Table 1: Two very different indexes
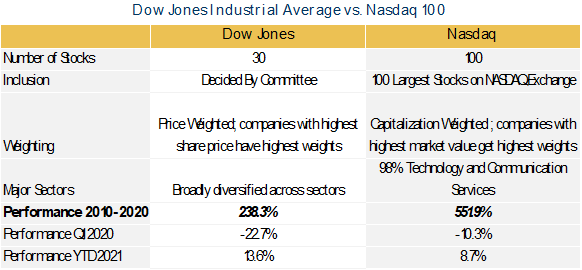
Past performance is no guarantee of future results. Shown for illustrative purposes. Not indicative of RiverFront portfolio performance. Index definitions are available in the disclosures.
Table 1 shows the significant differences between the composition of the two indexes and the substantial outperformance of the Nasdaq over the past ten years. This decade was characterized by low economic growth and low interest rates. These conditions placed a premium on companies who could generate strong growth in such an environment, favoring Technology versus the more cyclical sectors in the Dow. This can be seen clearly in the operating performance of each index during the period. In Table 2 we show sales growth (what companies make), as well as growth in earnings (what companies keep).
Table 2: Big difference in growth over the last 10 years
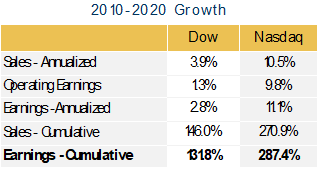
Past performance is no guarantee of future results. Shown for illustrative purposes. Not indicative of RiverFront portfolio performance. Index definitions are available in the disclosures.
The Nasdaq’s 10% annual sales growth compounded over the period to an increase of 170%, while the Dow was barely able to increase revenue by 50%. Furthermore, the Nasdaq’s more favorable cost structure led to an even bigger difference in earnings growth. This was enhanced by their strong balance sheets which allowed them to issue debt to buy back shares.
A bubble?
A question on our clients’ mind right now is: “Are US stocks in a bubble”? This is a reasonable question since the S&P 500 is close to all-time highs, and the market has largely shrugged off both a global pandemic and accompanied by a decline in 2020 earnings. At first glance one might wonder if stocks are trading on hope and conjecture rather than concrete fundamentals. We think not. This week we look at two indexes to gain insight into current valuations and prospects for two very different types of stocks, represented by the Dow Jones Industrials Index and the Nasdaq-100.
Table 3: We expect P/E multiples return to normal by 2022
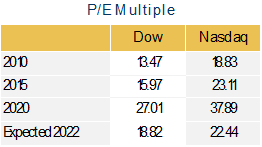
Past performance is no guarantee of future results. Shown for illustrative purposes. Not indicative of RiverFront portfolio performance. Index definitions are available in the disclosures.
Investor concerns about a stock bubble seem to center around valuations – specifically the price of these indexes relative to their earnings, their price-to-earnings ratio (P/E ratio). As we can see in Table 3 (see right) the Dow’s P/E ratio has grown from 13.5x in 2010 to 27.0x in 2020, while the Nasdaq’s has grown from 18.8x to 37.9x over the same time frame. Investors have rewarded Technology companies with significantly higher P/E multiples, which implicitly means investors expect Nasdaq companies to continue their rapid growth both in absolute terms, and relative to the companies in the Dow.
Table 4: Dow companies expected to recover more strongly
In our view, the reason the current valuations of both indexes are so high is that they are based on depressed 2020 earnings numbers. Bloomberg analysts are very confident earnings will recover strongly in 2021 and 2022 (see table 4 left) and we think they are right. Table 4 shows analysts’ consensus expected growth rates in both sales and earnings between 2020 and 2022. You will see how strong the recovery is expected to be, especially for the Dow. Achieving these numbers would get P/E multiples back down to a reasonable level, hence the belief that stocks are positioned to “grow into their multiples”.
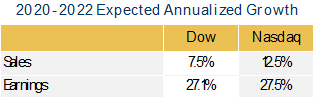
Past performance is no guarantee of future results. Shown for illustrative purposes. Not indicative of RiverFront portfolio performance. Index definitions are available in the disclosures.
Looking forward: Stocks versus Bonds
Low interest rates accompanied by stronger economic growth is a powerful combination. It enables consumers to continue to make large purchases (homes, cars, etc.), and it allows companies to continue to borrow money cheaply and use that as fuel for growth. This is a big driver of RiverFront’s preference for stocks over bonds since we believe returns from bonds are largely driven by starting yields. At current interest rates, we believe the bar is low for stocks to outperform.
…and Dow versus Nasdaq
To answer the question of which index will do better, we must make a few assumptions about how the future might play out. One of the things to note from the 2-year forward estimates is the sharper rebound in the Dow’s revenue and earnings growth. This is no coincidence; the operating structure of industrial companies is dependent on larger economic growth to fuel profitability. This “operating leverage” to the higher economic growth we expect is what we think can propel Dow-like companies to grow earnings more rapidly over the next 5 years than the previous 10. If the earnings growth appears sustainable, we could envision share prices of Dow-like companies rising faster than earnings.
For Nasdaq companies, we see some challenges:
While we think growth in sales and earnings will lead to continued profitability and positive market returns, we believe that growth will ultimately slow across the Nasdaq writ large, more than multiples currently reflect. Furthermore, we believe interest rates will logically increase after a period of growth, and this will eliminate the advantage that Growth companies have had issuing debt to buy back shares. Finally, although software and some hardware segments have unlocked new sources of growth, like cloud computing over the past few years, we see the potential for greater regulation and political scrutiny.
While most of this discussion has been comparing the two indexes, we believe that within in each index there are exceptions to our general guidance, and we think it is possible to do better than either index by choosing to own some of the big names and not others. In the Nasdaq, we favor software companies and companies that are consumer facing, due to their ability to help consumers and businesses recover from the pandemic. In contrast, we believe that communication services segments (streaming / internet) will struggle to maintain their growth due to a combination of slowing growth in streaming/connectivity and potential federal regulation.
In conclusion, three interesting takeaways come out of our analysis:
- Our view of the macro economy and the market favors the Dow over the Nasdaq. A consistent message from RiverFront has been the migration from Growth themes to Value-oriented themes, and this analysis hopefully explains some of the underpinnings.
- Security selection will continue to be a more important tool in our arsenal. Within the Nasdaq, there are companies that will and will not be able to meet or exceed the high expectations set for them. Similarly, in the Dow, there are businesses which will struggle to generate earnings out of economic growth. We expect to get more granular in our selections of sectors and stock themes, and to focus on companies at reasonable valuations that can grow earnings.
- Risk management of views and positioning is vital for this outlook. Our view is based on our current understanding of COVID-19 recovery, Fed Policy, Tax Policy, global economic relations, and global economic growth. As always when making longer term forecasts, we recognize that many of our current assumptions will not turn out exactly as we have laid out. This is why at RiverFront a key part of our process is adapting to new information in any of these areas and adjusting our plans accordingly. We like to refer to this philosophy as ‘process over prediction’.
Important Disclosure Information
The comments above refer generally to financial markets and not RiverFront portfolios or any related performance. Opinions expressed are current as of the date shown and are subject to change. Past performance is not indicative of future results and diversification does not ensure a profit or protect against loss. All investments carry some level of risk, including loss of principal. An investment cannot be made directly in an index.
Chartered Financial Analyst is a professional designation given by the CFA Institute (formerly AIMR) that measures the competence and integrity of financial analysts. Candidates are required to pass three levels of exams covering areas such as accounting, economics, ethics, money management and security analysis. Four years of investment/financial career experience are required before one can become a CFA charterholder. Enrollees in the program must hold a bachelor’s degree.
Information or data shown or used in this material was received from sources believed to be reliable, but accuracy is not guaranteed.
This report does not provide recipients with information or advice that is sufficient on which to base an investment decision. This report does not take into account the specific investment objectives, financial situation or need of any particular client and may not be suitable for all types of investors. Recipients should consider the contents of this report as a single factor in making an investment decision. Additional fundamental and other analyses would be required to make an investment decision about any individual security identified in this report.
In a rising interest rate environment, the value of fixed-income securities generally declines.
When referring to being “overweight” or “underweight” relative to a market or asset class, RiverFront is referring to our current portfolios’ weightings compared to the composite benchmarks for each portfolio. Asset class weighting discussion refers to our Advantage portfolios. For more information on our other portfolios, please visit www.riverfrontig.com or contact your Financial Advisor.
Investing in foreign companies poses additional risks since political and economic events unique to a country or region may affect those markets and their issuers. In addition to such general international risks, the portfolio may also be exposed to currency fluctuation risks and emerging markets risks as described further below.
Changes in the value of foreign currencies compared to the U.S. dollar may affect (positively or negatively) the value of the portfolio’s investments. Such currency movements may occur separately from, and/or in response to, events that do not otherwise affect the value of the security in the issuer’s home country. Also, the value of the portfolio may be influenced by currency exchange control regulations. The currencies of emerging market countries may experience significant declines against the U.S. dollar, and devaluation may occur subsequent to investments in these currencies by the portfolio.
Foreign investments, especially investments in emerging markets, can be riskier and more volatile than investments in the U.S. and are considered speculative and subject to heightened risks in addition to the general risks of investing in non-U.S. securities. Also, inflation and rapid fluctuations in inflation rates have had, and may continue to have, negative effects on the economies and securities markets of certain emerging market countries.
Stocks represent partial ownership of a corporation. If the corporation does well, its value increases, and investors share in the appreciation. However, if it goes bankrupt, or performs poorly, investors can lose their entire initial investment (i.e., the stock price can go to zero). Bonds represent a loan made by an investor to a corporation or government. As such, the investor gets a guaranteed interest rate for a specific period of time and expects to get their original investment back at the end of that time period, along with the interest earned. Investment risk is repayment of the principal (amount invested). In the event of a bankruptcy or other corporate disruption, bonds are senior to stocks. Investors should be aware of these differences prior to investing.
Technology and internet-related stocks, especially of smaller, less-seasoned companies, tend to be more volatile than the overall market.
Index Definitions:
Dow Jones Industrial Average Index — measures the stock performance of thirty leading blue-chip U.S. companies.
NASDAQ 100 Index includes 100 of the largest domestic and international non-financial securities listed on the Nasdaq Stock Market based on market capitalization.
Standard & Poor’s (S&P) 500 Index measures the performance of 500 large cap stocks, which together represent about 80% of the total US equities market.
RiverFront Investment Group, LLC (“RiverFront”), is a registered investment adviser with the Securities and Exchange Commission. Registration as an investment adviser does not imply any level of skill or expertise. Any discussion of specific securities is provided for informational purposes only and should not be deemed as investment advice or a recommendation to buy or sell any individual security mentioned. RiverFront is affiliated with Robert W. Baird & Co. Incorporated (“Baird”), member FINRA/SIPC, from its minority ownership interest in RiverFront. RiverFront is owned primarily by its employees through RiverFront Investment Holding Group, LLC, the holding company for RiverFront. Baird Financial Corporation (BFC) is a minority owner of RiverFront Investment Holding Group, LLC and therefore an indirect owner of RiverFront. BFC is the parent company of Robert W. Baird & Co. Incorporated, a registered broker/dealer and investment adviser.
To review other risks and more information about RiverFront, please visit the website at www.riverfrontig.com and the Form ADV, Part 2A. Copyright ©2021 RiverFront Investment Group. All Rights Reserved. ID 1693846
