
By Komson Silapachai, Partner, Research & Portfolio Management
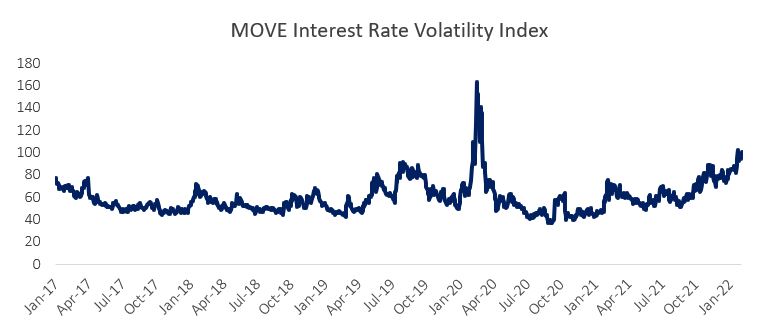
1. Uncertainty is at its Highest Level Since March 2020. The Russia/Ukraine war has injected a tremendous amount of uncertainty in the global growth and policy outlook, which has been reflected in a period of heightened volatility post-invasion of Ukraine on February 23. Interest rate volatility, as represented by the MOVE Index, has been moving higher since the fourth quarter of 2021 and is now at the highest level since the Covid crisis in March 2020.
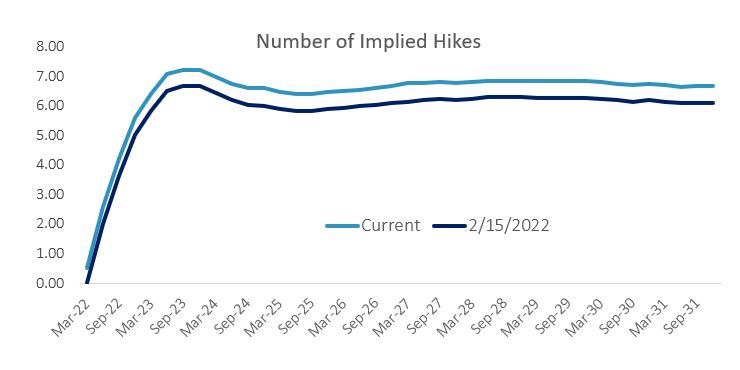
2. Rate Could Remain Lower Than Expected. Fed pricing has adjusted lower in response to the Russian invasion, as the interest rates markets are now only discounting six hikes through 2023 versus over seven hikes previously (on February 15, 2022). Given the heightened political risk premium and financial market instability, rates could remain lower than expected into the March Fed meeting.
3. Growth is Expected to Slow in 2022. The Atlanta Fed GDP estimate to start Q1 was close to 0% given early growth readings that are tracking below expectations. A build up in inventory in the second half of 2021, as well as a lower consumer spending path, are contributing to what looks like a slowdown. A lack of fiscal spending in 2022 will require the private sector to make up the difference, which is unlikely to happen. The consumer, which had built up significant savings due to stimulus and staying home, has spent much of it in the rebound. A savings rate at pre-Covid levels (as well as increasing credit card debt) support this notion.

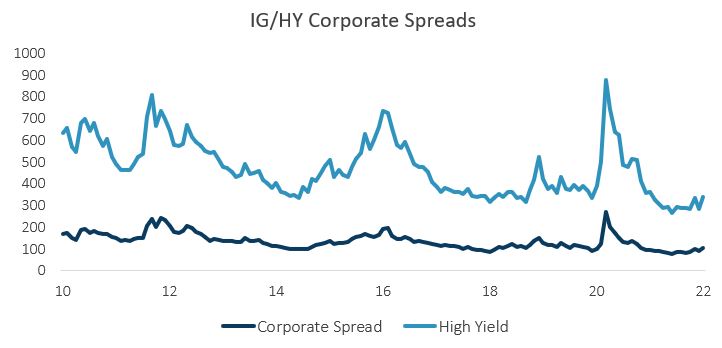
4. While Rates Have Repriced, Credit Remains Resilient. Corporate bond spreads continue to trade at near-historic lows given the repricing in rates and equities. One factor supporting U.S. credit may be flows from foreign investors looking for attractive yield pickup without currency risk.
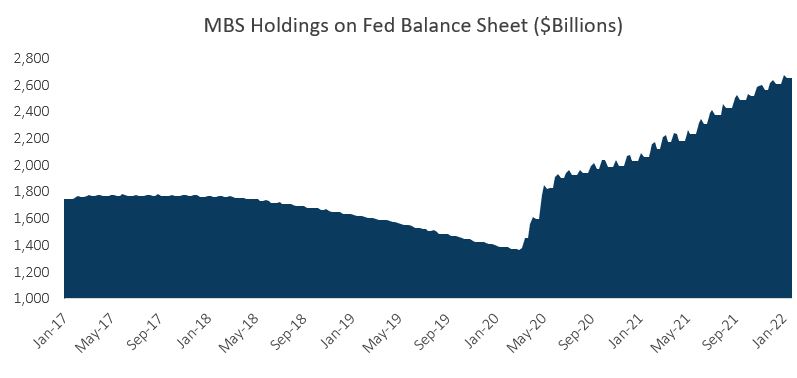
5. With Fed QE Ending, Net Supply Could Result in Cheaper MBS. The Fed purchased over $1.2 trillion of agency MBS over the past two years, providing demand to meet higher MBS supply. Absent QE, asset managers will have to absorb an additional $500 billion in MBS supply this year, which could widen MBS spreads. This could present a buying opportunity once spreads adjust.
Source on all charts is Sage, Bloomberg.
Disclosures: This is for informational purposes only and is not intended as investment advice or an offer or solicitation with respect to the purchase or sale of any security, strategy or investment product. Although the statements of fact, information, charts, analysis and data in this report have been obtained from, and are based upon, sources Sage believes to be reliable, we do not guarantee their accuracy, and the underlying information, data, figures and publicly available information has not been verified or audited for accuracy or completeness by Sage. Additionally, we do not represent that the information, data, analysis and charts are accurate or complete, and as such should not be relied upon as such. All results included in this report constitute Sage’s opinions as of the date of this report and are subject to change without notice due to various factors, such as market conditions. Investors should make their own decisions on investment strategies based on their specific investment objectives and financial circumstances. All investments contain risk and may lose value. Past performance is not a guarantee of future results.
Sage Advisory Services, Ltd. Co. is a registered investment adviser that provides investment management services for a variety of institutions and high net worth individuals. For additional information on Sage and its investment management services, please view our web site at www.sageadvisory.com, or refer to our Form ADV, which is available upon request by calling 512.327.5530.
