
While the current landscape is challenging, we find many reasons to be optimistic about what the next business cycle has in store. In aggregate, U.S. households are prepared to weather the looming economic challenges as they are in great shape relative to history. We acknowledge the challenges individual families are dealing with and the understanding that each family’s situation is unique. When we are generating our outlook for the overall economy, we need to consider trends for the economy in aggregate as economic activity for the country combines the income, savings, investing, and spending from all families, businesses, and areas of government.
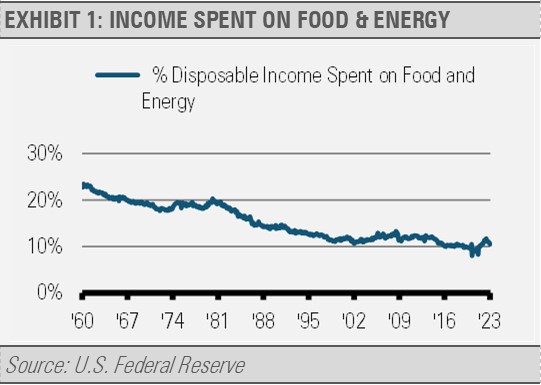
For example, spending on energy and food relative to disposable income is still well below historical levels despite their recent surge in prices (exhibit 1). Household spending on food and energy amounted to 24% of disposable income in January 1959, 18.5% in January 1979, 13.8% in January 1990, and 10.55% in February 2023. In fact, spending on food and energy relative to disposable income would have to increase nearly 50% just to get back to the average over the last 65 years. Higher food and energy costs may change consumer spending habits, but it will not likely challenge economic growth overall.
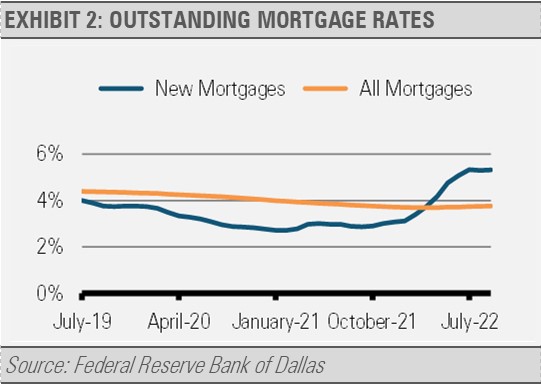
Furthermore, while food and energy prices can be volatile, household mortgage rates are usually locked in for decades. According to the U.S. Federal Reserve (Fed), 96% of mortgages are fixed rate. As exhibit 2 shows, most homeowners have locked in historically low interest rates even though interest rates on new mortgages have increased recently.
As of September 2022, the average mortgage interest rate was 3.8% while only 31% of mortgages were at a rate over 4%. As with historically low food and energy prices relative to disposable income, these historically low interest rates leave households with much more spending flexibility than in the past.
Looking at these and other factors, we think that the private sector and households are in relatively good shape to be able to weather the economic challenges we see ahead. Near-term economic challenges primarily stem from tightening monetary and credit conditions. Just as we cautioned against the government, especially the Fed, over-stimulating the economy in 2021, we now think the Fed has been overtightening monetary policy since late 2022.
Given that shifts in monetary policy affect the economy with long and varying time lags, we do not think that the impact of the Fed’s policy tightening over the last year has been fully realized. For example, it took about a year for inflation to really take off in response to the government’s massive stimulus enacted during the COVID-19 pandemic. We expect a similar time lag resulting from the Fed’s moves to fight that inflationary impulse.
In addition to the Fed’s policy tightening, the banking sector had already begun to tighten lending standards prior to the latest bank failures. As banks tighten lending standards, businesses and individuals have more difficulty borrowing funds for everything from purchasing new plant and equipment to buying a car or house. That leads to less money in the economy, which slows economic growth and inflation as well as potentially steering us into a recession.
Looking further out, the private sector is set to provide an excellent foundation upon which the U.S. will launch its next business cycle. Our longer-term, strategic forecasts for equity and fixed income market returns are quite optimistic. Our work suggests that we should expect a roughly 8% annualized total return from equities and 5% from core fixed income over the next several years.
Our reasons for long-term optimism are multifaceted. Starting from a strong position, the U.S. is the only major economy that combines an overall strong private sector financial position, a growing labor force, and innovation-driven productivity growth.
At more than 166 million people, the size of the civilian labor force 16 years old and above is now larger than its previous peak in December 2019. More workers in the labor force increases our economic potential. Combined with the U.S. tendency to drive productivity growth through innovation, a growing labor force where each worker also has the potential to be more productive can be a very potent combination. Developing trends in on-shoring and near-shoring of manufacturing is yet another pillar that supports this positive outlook. The U.S. labor force and consumers stand to benefit from an abundance of jobs and less supply chain fragility.
INVESTMENT IMPLICATIONS
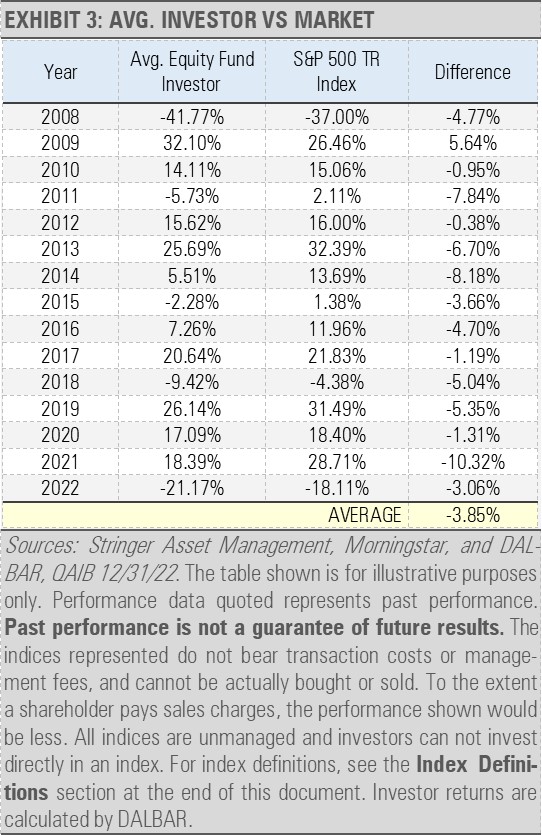
We are defensively positioned currently given our near-term outlook combined with our understanding that market timing is futile. We favor this approach rather than waiting in cash and trying to time the market because we know from history that market timing does not work. Timing the market has proven difficult even in environments with a more constructive economic backdrop. According to DALBAR’s data (exhibit 3), as the economy and markets recovered from the pandemic lockdowns, 2021 represented one of the biggest market timing misses on record.
Our Three Layers of Risk Management approach (strategic, tactical, and the Cash Indicator) helps us navigate near-term challenges while still focused on long-term gains. Our strategic, longer-term outlook is optimistic, and our tactical work suggests that the coming months are likely to be challenging for the global economy and financial markets. As a result, we are defensively positioned with overweights to U.S. Treasuries, which we think can provide meaningful upside over the coming year or two, as well as defensive equity sectors, such as health care and consumer staples, that can provide protection through consistent earnings. We also favor alternative income sources, such as options writing strategies and MLPs, which can offer strong cashflows and yields. We think that utilizing diversified sources of return such as these will be important to navigate the uncertainties ahead by managing equity and credit market risks.
The challenges ahead will not last forever, and investors should not lose their way just because markets face difficulties from time to time. It is always important to stick to your long-term financial plan. Following a disciplined approach, such as our Three Layers of Risk Management, may help investors better navigate the near-term risks and set them up for long-term rewards.
THE CASH INDICATOR
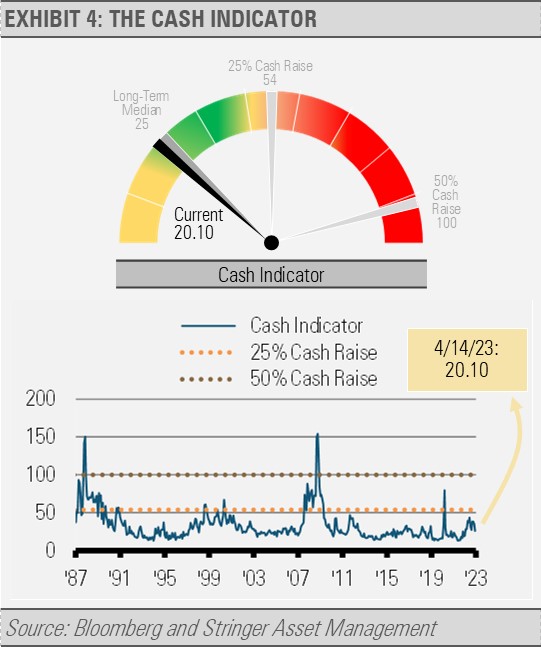
The Cash Indicator (CI) is near its historically normal levels. The CI can be an extremely valuable tool helping us to identify systematic market breakdowns by measuring the relationship between fear in equity and fixed income markets. While our fundamental outlook is cautious and our positioning is likewise defensive, the CI suggests little risk of a near-term market meltdown. Though we expect stresses ahead, the CI indicates that markets will likely continue to operate within historical norms. Diversification across asset classes will likely be the best risk management strategy.
DISCLOSURES
Any forecasts, figures, opinions or investment techniques and strategies explained are Stringer Asset Management, LLC’s as of the date of publication. They are considered to be accurate at the time of writing, but no warranty of accuracy is given and no liability in respect to error or omission is accepted. They are subject to change without reference or notification. The views contained herein are not to be taken as advice or a recommendation to buy or sell any investment and the material should not be relied upon as containing sufficient information to support an investment decision. It should be noted that the value of investments and the income from them may fluctuate in accordance with market conditions and taxation agreements and investors may not get back the full amount invested.
Past performance and yield may not be a reliable guide to future performance. Current performance may be higher or lower than the performance quoted.
The securities identified and described may not represent all of the securities purchased, sold or recommended for client accounts. The reader should not assume that an investment in the securities identified was or will be profitable.
Data is provided by various sources and prepared by Stringer Asset Management, LLC and has not been verified or audited by an independent accountant.
Index Definitions:
S&P 500 Total Return Index – This Index is a capitalization-weighted index of 500 stocks. The Index is designed to measure performance of a broad domestic economy through changes in the aggregate market value of 500 stocks representing all major industries. The total return calculation provides investors with a price plus gross cash dividend return. Gross cash dividends are applied on the ex-date of the dividend.
