
By Chris Konstantinos, CFA, Director of Investments, Chief Investment Strategist
SUMMARY
- We believe the Fed will be resolute in confronting inflation…
- …and thus believe the bond market’s recent opinion change in the future path of interest rates is too extreme.
- Until yields reach higher levels, we are cautious around securities with interest rate sensitivity.
Powell’s Tone Softens, But Bond Market Overreacts
Even in normal times, we do not envy the Federal Reserve’s job of trying to balance the sometimes-contradictory goals of full employment and price stability. Since Chairman Jay Powell’s every utterance is scrutinized, one can appreciate the Fed’s communication dilemma as it stands today; lean too ‘dovish’, and inflation expectations may become unmoored, threating long-term price stability. Lean too ‘hawkish’ with higher interest rates…and threaten to exacerbate a ‘run’ on the banks and push the US economy into recession. Powell and the Fed are attempting to ‘tap dance on a tightrope,’ perfectly balancing the need for price stability with financial stability. Scarcely two weeks after guiding the public towards the possibility of a 50bp (0.5%) interest rate hike due to persistent inflation, the Fed was forced by the banking crisis (see last week’s Weekly View) to recalibrate towards a smaller hike and a less hawkish message in the Federal Open Market Committee (FOMC) meeting last week.
At that meeting, the Fed raised its fed funds target range by 25 basis points to 4.75-5.00% and left its median year-end rate projection at 5.125%. Bond yields plunged during the Q&A after Powell admitted that a pause in rate hikes was considered in the meeting and investors noted the shift in wording of the Fed’s statement where ‘may’ and ‘some’ replaced ‘ongoing’ in reference to rate hikes. The futures market now expects rate cuts to come as soon as the Fed’s July meeting, pricing over a 54% chance of a 25-bps cut.
Source: Refinitiv Datastream, RiverFront. Data as of March 23, 2023. Chart shown for illustrative purposes. Past performance is no guarantee of future results.
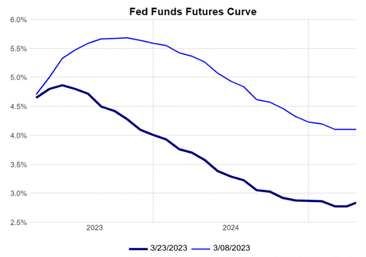
While we acknowledge this change of tone and that the probability of recession has risen, we believe the bond market’s substantial recent opinion change in the future path of interest rates is too extreme (see fed funds futures chart below). This Fed tap dance naturally lends itself to misunderstanding and confusion with regards to future Fed policy. This is shown not only in the stock market’s recent intra-day volatility, but particularly in the disconnect between official Fed guidance – the median forecast in
the infamous ‘dot plot’ of Fed interest rate projections – and the bond market’s implied path of future interest rates. We think the bond market is currently underestimating the Fed’s resolve around controlling inflation. Thus, we plan on remaining underweight interest rate sensitivity in the fixed income side of our asset allocation portfolios until yields reach higher levels.
Fed In Tap-Dance Mode…But Likely To Err On Side Of Inflation Control
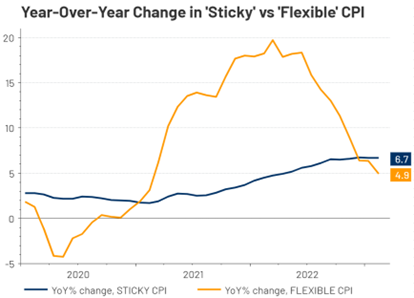
Source: Refinitiv Datastream, RiverFront. Data monthly as of February 15, 2023. Chart left shown for illustrative purposes.
Powell reiterated both the FOMC’s 2% inflation target and that participants don’t see rate cuts in 2023. When push comes to shove, we believe this Fed will ultimately prioritize price stability, and thus the interest rate path from here may be higher than the market is currently pricing in. The chart above of the fed fund futures curve (where today’s interest rate expectations are represented by the dark blue line) depicts how much those expectations have dropped since the start of the banking crisis rate on March 8th (lighter blue line). Instead of lowering Fed Funds, we think the Fed will choose to support financial stability by continuing to use its balance sheet to create liquidity for banks and depositors.
One important reason we think the bond market is underestimating the Fed’s resolve is the stubborn persistence of what the Fed refers to as ‘sticky-price inflation’, which makes up the majority of consumer spending (see chart, left). While more ‘flexible’ indicators such as fuel have corrected (orange line), stickier items such as rents, health care and education costs are still at elevated levels and not dropping as the Fed would prefer (blue line).
Portfolio Positioning – What Signals We Are Watching
With regard to overall stock weightings in our portfolios, we remain generally neutral relative to our policy targets. Given the uncertain economic outlook, we are favoring strong cash flow business models and carrying a slightly elevated level of cash for additional flexibility. This is our attempt to respect both the low visibility into the future state of the economy as well as the relatively resilient message of the stock market thus far. When visibility is this low, we think being neutral and nimble in our positioning is the prudent stance.
From a risk management perspective, we continue to monitor 1) the ‘message of the market’ (Technical Update section, below) 2) signals of stress coming from the credit and commodity markets, and 3) changes in the size of the Fed balance sheet.
From a credit & commodity perspective, neither market is showing signs of stress to us. For example, credit default swaps (CDS – the price of hedging default risk) for high yield bonds was virtually unchanged at +528 bps over the last week, still below what we view as the ‘cautionary zone’ of +600 bps. A move of CDS meaningfully above the +600 level may signal trouble for the sector and for overall risk-taking, in our opinion. Commodity prices generally remain depressed relative to 2022 levels. This suggests to us that global industrial growth continues to struggle, though flash Purchasing Managers’ Index (PMI) for March released on Thursday, indicated that services businesses in both the US and Europe were both in expansion and improving.
The Fed’s balance sheet is beginning to decline after a substantial recent increase. According to Fed data quoted by Bloomberg, two of the main Fed banking backstop facilities remained elevated, a sign that banks continue to feel stress from deposit outflow. These borrowings, however, did drop slightly from the week before, suggesting the ‘bank run’ we discussed in the Weekly View last week has not gotten worse.
Technical Update: Not Much Changed From Last Week…Stocks Remain Resilient Thus Far
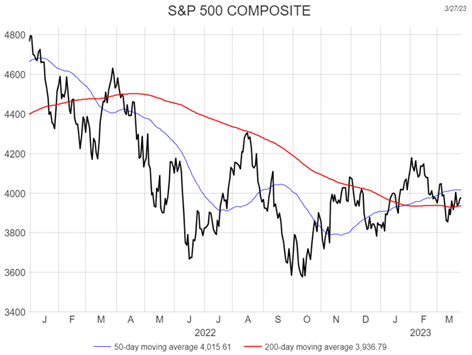
Source: Refinitiv Datastream, RiverFront. Data monthly as of March 27, 2023. Chart shown for illustrative purposes.
Our technical view on markets has not changed much from our discussion in last week’s Weekly View. Despite the massive amount of intraday volatility in the stock market, the S&P 500 remains not far from its 200-day moving average at approximately 3940 and above what we view as important technical support at 3800 (see chart right). We continue to be impressed with the market’s resiliency in the face of a banking crisis.
The ‘Golden Cross’, a positive technical condition we have mentioned before– where the 50-day moving average has risen above the 200-day – is still in effect. Crowd sentiment has also continued to move deeper into pessimistic levels on both the shorter and longer-term time frames. This is usually viewed as a contrarian indicator where pessimistic readings are usually interpreted as positive for future market returns. However, we would have preferred that sentiment hadn’t fallen so far so quickly, as it calls into question the durability of the currently fragile recent uptrend. We expect the market to be range-bound for the time being, with a likely ‘decision box’ between 3800-4200, placing increased importance on either a break below or above these levels. We believe it will be difficult for the S&P 500 to rally substantially higher from current levels with the current financial headwinds and their impact on the economy.
Risk Discussion: All investments in securities, including the strategies discussed above, include a risk of loss of principal (invested amount) and any profits that have not been realized. Markets fluctuate substantially over time, and have experienced increased volatility in recent years due to global and domestic economic events. Performance of any investment is not guaranteed. In a rising interest rate environment, the value of fixed-income securities generally declines. Diversification does not guarantee a profit or protect against a loss. Investments in international and emerging markets securities include exposure to risks such as currency fluctuations, foreign taxes and regulations, and the potential for illiquid markets and political instability. Please see the end of this publication for more disclosures.
Important Disclosure Information:
The comments above refer generally to financial markets and not RiverFront portfolios or any related performance. Opinions expressed are current as of the date shown and are subject to change. Past performance is not indicative of future results and diversification does not ensure a profit or protect against loss. All investments carry some level of risk, including loss of principal. An investment cannot be made directly in an index.
Information or data shown or used in this material was received from sources believed to be reliable, but accuracy is not guaranteed.
This report does not provide recipients with information or advice that is sufficient on which to base an investment decision. This report does not take into account the specific investment objectives, financial situation or need of any particular client and may not be suitable for all types of investors. Recipients should consider the contents of this report as a single factor in making an investment decision. Additional fundamental and other analyses would be required to make an investment decision about any individual security identified in this report.
Chartered Financial Analyst is a professional designation given by the CFA Institute (formerly AIMR) that measures the competence and integrity of financial analysts. Candidates are required to pass three levels of exams covering areas such as accounting, economics, ethics, money management and security analysis. Four years of investment/financial career experience are required before one can become a CFA charterholder. Enrollees in the program must hold a bachelor’s degree.
All charts shown for illustrative purposes only. Technical analysis is based on the study of historical price movements and past trend patterns. There are no assurances that movements or trends can or will be duplicated in the future.
Ned Davis Research (NDR) is a global provider of independent investment research, solutions and tools. Founded in 1980, NDR helps clients around the world make objective investment decisions.
Stocks represent partial ownership of a corporation. If the corporation does well, its value increases, and investors share in the appreciation. However, if it goes bankrupt, or performs poorly, investors can lose their entire initial investment (i.e., the stock price can go to zero). Bonds represent a loan made by an investor to a corporation or government. As such, the investor gets a guaranteed interest rate for a specific period of time and expects to get their original investment back at the end of that time period, along with the interest earned. Investment risk is repayment of the principal (amount invested). In the event of a bankruptcy or other corporate disruption, bonds are senior to stocks. Investors should be aware of these differences prior to investing.
In general, the bond market is volatile, and fixed income securities carry interest rate risk. (As interest rates rise, bond prices usually fall, and vice versa). This effect is usually more pronounced for longer-term securities). Fixed income securities also carry inflation risk, liquidity risk, call risk and credit and default risks for both issuers and counterparties. Lower-quality fixed income securities involve greater risk of default or price changes due to potential changes in the credit quality of the issuer. Foreign investments involve greater risks than U.S. investments, and can decline significantly in response to adverse issuer, political, regulatory, market, and economic risks. Any fixed-income security sold or redeemed prior to maturity may be subject to loss.
Investments in international and emerging markets securities include exposure to risks such as currency fluctuations, foreign taxes and regulations, and the potential for illiquid markets and political instability.
When referring to being “overweight” or “underweight” relative to a market or asset class, RiverFront is referring to our current portfolios’ weightings compared to the composite benchmarks for each portfolio. Asset class weighting discussion refers to our Advantage portfolios. For more information on our other portfolios, please visit riverfrontig.com or contact your Financial Advisor.
Index Definitions:
Standard & Poor’s (S&P) 500 Index measures the performance of 500 large cap stocks, which together represent about 80% of the total US equities market.
The Consumer Price Index (CPI) is a measure that examines the weighted average of prices of a basket of consumer goods and services, such as transportation, food, and medical care. It is calculated by taking price changes for each item in the predetermined basket of goods and averaging them. Changes in the CPI are used to assess price changes associated with the cost of living. The CPI is one of the most frequently used statistics for identifying periods of inflation or deflation.
The Purchasing Managers’ Index (PMI) is an index of the prevailing direction of economic trends in the manufacturing and service sectors. It consists of a diffusion index that summarizes whether market conditions, as viewed by purchasing managers, are expanding, staying the same, or contracting. The purpose of the PMI is to provide information about current and future business conditions to company decision makers, analysts, and investors.
Definitions:
The Federal Reserve System (FRS) is the central bank of the United States. Often simply called the Fed, it is arguably the most powerful financial institution in the world. It was founded to provide the country with a safe, flexible, and stable monetary and financial system. The Fed has a board that is comprised of seven members. There are also 12 Federal Reserve banks with their own presidents that represent a separate district.
Fed funds futures are financial futures contracts based on the federal funds rate and traded on the Chicago Mercantile Exchange (CME) operated by CME Group Inc. (CME). The federal funds rate is the rate banks charge each other for overnight loans of reserves on deposit with the Federal Reserve.
A credit default swap (CDS) is a financial derivative that allows an investor to swap or offset their credit risk with that of another investor. To swap the risk of default, the lender buys a CDS from another investor who agrees to reimburse them if the borrower defaults.
The 50-day simple moving average (SMA) is used by traders as an effective trend indicator. The 50-day moving average is the leading average of the three most commonly used averages. Because it’s shorter than the 100- and 200-day averages, it’s the first line of major moving average support in an uptrend and the first line of major moving average resistance in a downtrend.
The 200-day moving average is a popular technical indicator which investors use to analyze price trends. It is simply a security’s average closing price over the last 200 days.
Interest rate sensitivity is a measure of how much the price of a fixed-income asset will fluctuate as a result of changes in the interest rate environment. Securities that are more sensitive have greater price fluctuations than those with less sensitivity. This type of sensitivity must be taken into account when selecting a bond or other fixed-income instrument the investor may sell in the secondary market. Interest rate sensitivity affects buying as well as selling.
RiverFront Investment Group, LLC (“RiverFront”), is a registered investment adviser with the Securities and Exchange Commission. Registration as an investment adviser does not imply any level of skill or expertise. Any discussion of specific securities is provided for informational purposes only and should not be deemed as investment advice or a recommendation to buy or sell any individual security mentioned. RiverFront is affiliated with Robert W. Baird & Co. Incorporated (“Baird”), member FINRA/SIPC, from its minority ownership interest in RiverFront. RiverFront is owned primarily by its employees through RiverFront Investment Holding Group, LLC, the holding company for RiverFront. Baird Financial Corporation (BFC) is a minority owner of RiverFront Investment Holding Group, LLC and therefore an indirect owner of RiverFront. BFC is the parent company of Robert W. Baird & Co. Incorporated, a registered broker/dealer and investment adviser.
To review other risks and more information about RiverFront, please visit the website at riverfrontig.com and the Form ADV, Part 2A. Copyright ©2023 RiverFront Investment Group. All Rights Reserved. ID 2814094
