
Our Cash Indicator methodology acts as a plan in case of an emergency. This is analogous to the multiple safety systems in a modern automobile, which includes an airbag. Importantly, each of these systems work together to potentially help smooth the ride.
We manage risk within our strategic, long-term allocations based on diversification across equity, fixed income, and alternative assets and a focus on more attractive relative values.
We manage risk tactically over the short-term by investing across a broad array of themes and asset classes including cash. We can either invest opportunistically or defensively depending on the environment.
Cash Indicator: Markets are functioning properly, but we expect increased volatility.
January 31, 2025
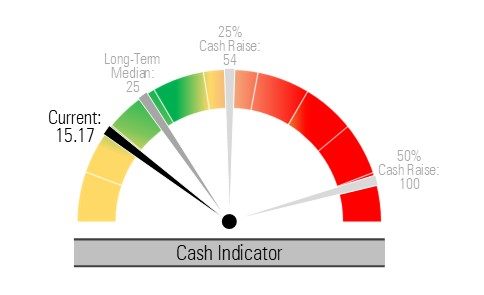
Our proprietary Cash Indicator (CI) provides insight into the health of the market by monitoring the level of fear using equity and fixed income indicators. This warning system is designed to signal us to either a 25% or 50% cash position to potentially protect principle and provide liquidity to reinvest at lower and more attractive valuations.
The CI has elevated again due to increased equity market volatility. Still, the current CI level remains below historical norms. We think that investors should expect more market volatility ahead. We view downside volatility as a buying opportunity amid the strong economic backdrop.
Strategic View: Economic growth can support higher equity prices while high quality fixed income appears attractive.
Equity Valuations: While the S&P 500 Index is expensive relative to history, the equal-weight version of the index is priced much more attractively, as are midcap and small caps.
Equity Favorability: We expect the U.S., propelled by innovation and relatively strong fundamentals, to continue to lead global equity markets. Attractive current valuations outside of the S&P 500 Index can lead to better future returns.
Fixed Income Valuations: At current interest rates, high quality fixed income looks very attractive while high yield is less attractive on a risk-reward basis.
Fixed Income Favorability: Our allocations are positioned to generate attractive current yield while protecting against large interest rate moves and the risk of credit deterioration. We expect the Federal Reserve to slowly reduce short-term interest rates further. We are finding attractive opportunities to lock in current income levels in the belly of the yield curve through investment grade fixed income instruments while long-term interest rates do not adequately compensate investors for the associated risks.
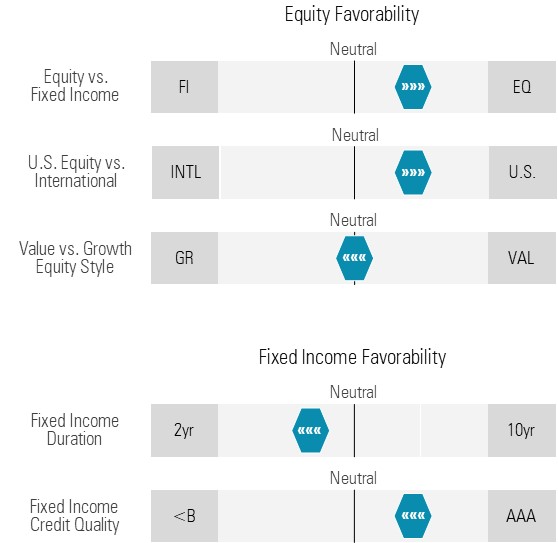
Tactical View: We favor quality and defensive equity, as well as investment grade intermediate fixed income.
We expect slower momentum in U.S. economic growth and equity markets over the next year but maintain a broadly positive outlook. As a result, we broadly increased our allocations to the U.S. equity market while reducing foreign equity market allocations across various Strategies. We also added an opportunistic fixed income ETF that targets relative value opportunities across bond sectors, such as corporate and mortgage-backed debt, to capture yields and manage the risks.
| Equity | U.S. » consumer discretionary*, growth*, insurance*, quality*, technology*
Global » dividends, emerging markets xChina*, quality |
| Fixed Income | short-duration commercial mortgage-backed securities and Treasuries*,
defined-maturity core fixed income, taxable munis* |
| Alternatives | equity option overlay strategies |
*areas that we are tactically emphasizing
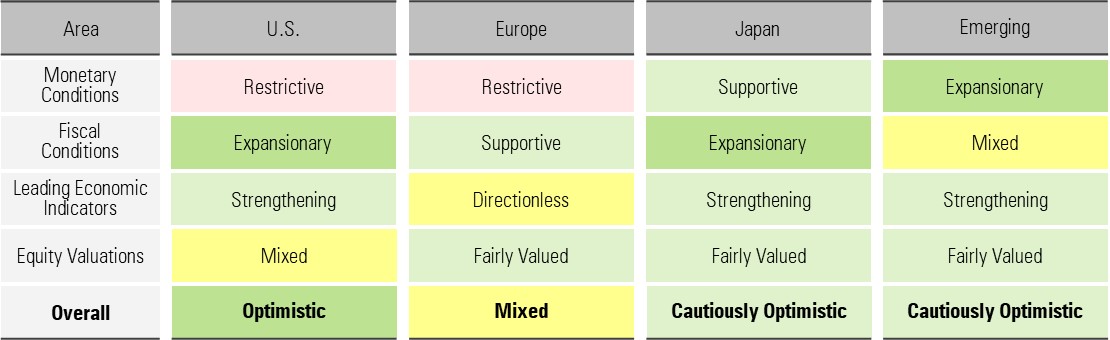
Global Broad Outlook: We expect global economic growth to persist despite softening economic indicators.
For more news, information, and strategy, visit the ETF Strategist Channel.
DISCLOSURES
Any forecasts, figures, opinions or investment techniques and strategies explained are Stringer Asset Management, LLC’s as of the date of publication. They are considered to be accurate at the time of writing, but no warranty of accuracy is given and no liability in respect to error or omission is accepted. They are subject to change without reference or notification. The views contained herein are not be taken as an advice or a recommendation to buy or sell any investment and the material should not be relied upon as containing sufficient information to support an investment decision. It should be noted that the value of investments and the income from them may fluctuate in accordance with market conditions and taxation agreements and investors may not get back the full amount invested.
Past performance and yield may not be a reliable guide to future performance. Current performance may be higher or lower than the performance quoted.
Data is provided by various sources and prepared by Stringer Asset Management, LLC and has not been verified or audited by an independent accountant.
