
Summary
- Value and momentum equities exhibited significant performance last week raising short-term questions about factor crowding and long-term questions about appropriate factor diversification.
- We explore the idea of appropriate factor diversification through the lens of a retiring investor, asking the question, “are all equity styles appropriate at all points in an investor’s lifecycle?”
- Using a backwards induction method, we simulate portfolio decisions are derive optimal portfolios based upon an investor’s age and net-worth relative to their desired spending level.
- We find that portfolios are split into four distinct zones – the zone of safety, the cone of balance, the triangle of growth, and the twilight zone – each representing a distinct asset allocation.
Calm headline returns last week belie a tumultuous undercurrent in factor equities. Specifically, value and momentum equities both performed a rapid turnaround relative to recent performance. When all was said and done, the rotation between the two factors resulted in a weekly performance spread of over 900 basis points.
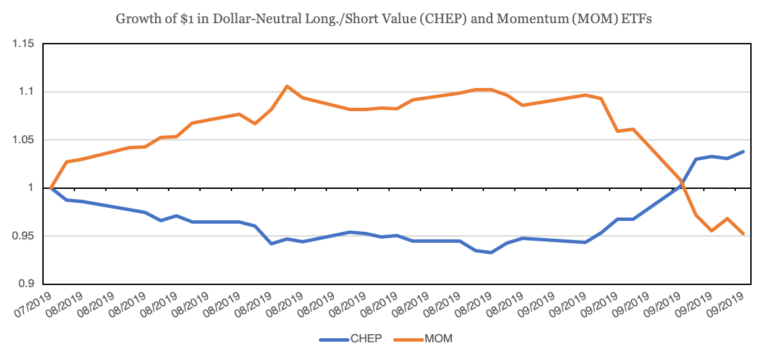
Source: CSI Data; Calculations by Newfound Research. Results assume the reinvestment of all distributions. Results are gross of all fees, including, but not limited to, manager fees, transaction costs, and taxes. Past performance is not an indicator of future results.
This abrupt course correction raised eyebrows throughout the quant world. Some took to measuring the historical rarity of the event. Others opined about the impact of factor crowding and the potential ensuing risks to portfolio construction. Many reminisced about the 2007 quant quake and wondered, “who blew up this time?”
There were those who swore these tea leaves prophesized doom and gloom and those who crossed their fingers that value might finally be making a comeback, but the majority simply shrugged and said, “stay the course.” Which, barring truly unusual circumstances, tends to be the prudent course of action.
It was, ironically, a particularly bad week for us to publish a research note that used a momentum / low-volatility portfolio barbell as a core example [1], as low-volatility equities and momentum moved in directional lockstep with one another all week.

Source: CSI Data; Calculations by Newfound Research. Results assume the reinvestment of all distributions. Results are gross of all fees, including, but not limited to, manager fees, transaction costs, and taxes. Past performance is not an indicator of future results.
When quants talk about factor crowding, there are really two types of crowding that can occur:
- The first occurs when too many investors crowd into the same trade. The most common way to measure this type of crowding is by looking at valuation spreads between the two legs of the trade. For example, crowding into growth stocks may cause value spreads between growth and value equities to widen to a historically unusual level (e.g. the dot-com era). Similarly, crowding into value stocks would lead to an unusually compressed spread in relative valuation between value and growth stocks.
- The second is when multiple factors crowd into the same trade. This can occur when multiple factors – especially when implemented in an unconstrained fashion – identify the same securities as being attractive. For example, if low-volatility stocks are out-performing their peers, momentum portfolios may rotate into these winners. This can cause two sets of investors to rotate into the same securities, causing crowding.
The latter form of crowding can be measured through holdings-based analysis (e.g. determining positional overlaps) or statistical analysis (e.g. correlation-based).
Below we plot the rolling correlation between residual momentum style returns with other popular factors. We can see that while momentum has historically had a relatively high correlation with –growth–, its correlation with –low volatility– is significantly time-varying. Prior to this week, the correlation between momentum and low volatility had climbed from -0.3 to north of 0.5 in 2019.
Click here to read the full article on Newfound Research.
