
By Rusty Vanneman, CFA, CMT, Chief Investment Officer and Dustin Dorhout, Research Analyst, CLS Investments
At CLS Investments, we pride ourselves on being innovators as well as one of the first ETF strategists in the industry. We have several internal tools to help us manage our various ETF portfolios and strategies. These include our proprietary expected return and expected risk scores, along with our own internal risk and factor reports.
In addition to using detailed, frequently refreshed data to help ourselves take big-picture view of the ETF landscape, we also produce a weekly report called the CLS ETF Dashboard.
The report calculates two universes: U.S.-domiciled ETFs and those currently held by CLS. These are broken down into four quadrants with each universe displayed in both simple and weighted-average terms. The metrics displayed within these quadrants include, but are not limited to, assets under management (AUM), fund count, expense/turnover/tax-cost ratios, average spreads, and daily volume.
These metrics are further broken out in four ways: management style (market-cap and smart beta), asset class (equity and alternative), region (U.S. and emerging markets), and equity style (based on the Morningstar style indexes). Lastly, we show various data points as graphs and utilize tables to illustrate the changes across various time frames. These allow us to dissect the data for optimal use.
We believe this structure gives us more time to analyze the data and determine how the external information we gather fits into what we are seeing. In so doing, we can create a visual model of the patterns that emerge and make connections in the data. For example, the CLS ETF Dashboard keeps track of flows, which allow us to see how investors are timing the market. This gives our team insight into how the industry is positioning itself.
Most recently, we conducted a year-over-year comparison using the CLS ETF Dashboard from the beginning of March. Below are some interesting observations:
- There has been a consistent increase in smart beta and actively managed ETFs. Year-over-year, as a percentage of AUM, smart beta has increased by about 90 bps (nine-tenths of 1%), and active funds have seen an approximately 60 bps increase. A key data point to note, coinciding with the rise of smart beta and active funds is the negative 135 bps drop in market-cap funds as a percentage of AUM during this same time frame.
- When looking at total AUM over the past 12 months from a percentage-change perspective, active funds have seen an increase of about 51%, making the impressive, approximately 17% change in smart beta funds look like a bad year.
- One reason for the large movement into active asset flows is investors’ flight to fixed-income assets, given the volatility last year. Fixed income, as a percentage of AUM, gained 180 bps. This was at the expense of all other asset classes, which were negative.
- Active funds tend to be most utilized in less-efficient areas of the market, which is certainly an observable quality in fixed income.
- Investors moved toward international regions. Most strikingly, developed international markets, as percentage of AUM, saw a nearly 4% increase.
- This demand for international exposure can also be observed in the change in available ETFs. From a percentage-change lens, and as a percentage of funds, developed and emerging markets increased about 27.4% and about 10%, respectively. The U.S. increased approximately 10.5%.
- We see several catalysts for the higher interest in international ETFs. International ETFs provided downside protection in the miserable fourth quarter of 2018, a stabilizing dollar has mitigated downward pressure on foreign markets, and international markets are trading at a steep discount to the U.S.
At CLS, we have watched these transformations closely. Seeing the data and trends is important for idea generation and further analysis, but it also provides insight into how we differ from the general ETF market.
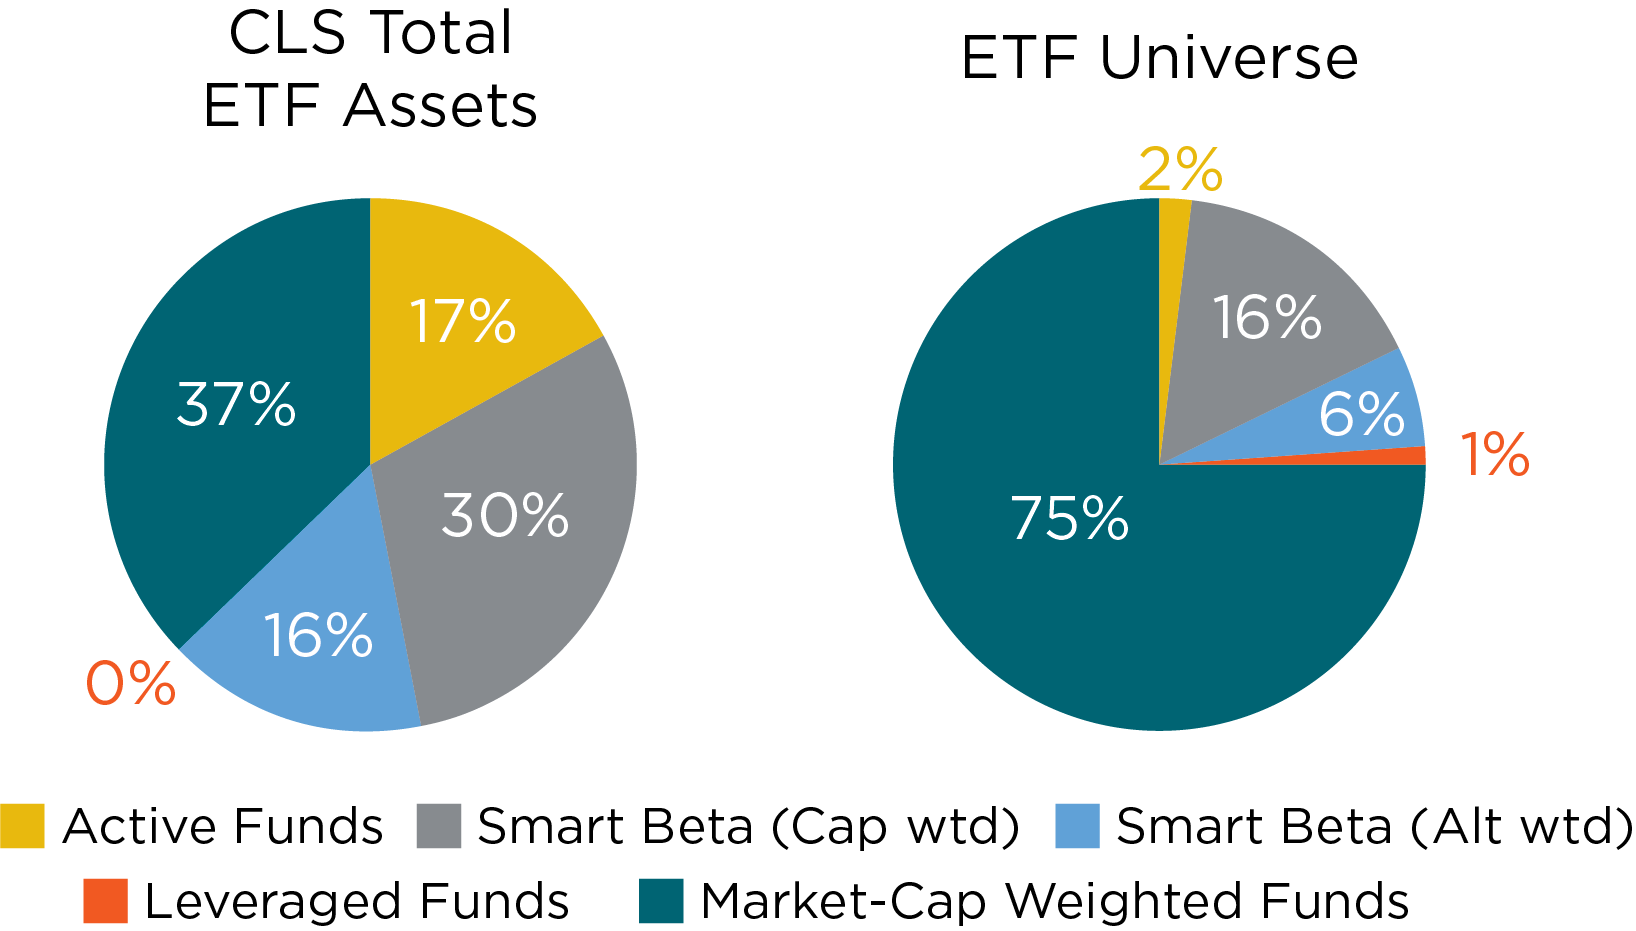
The charts below show that the styles of ETFs under management between CLS and the ETF universe are significantly different. This comes from our core positioning, which is expressed in our CLS Investment Themes, most notably Be Active and Be Smart.
Part of Be Active stems from CLS’s preference for actively managed funds. CLS has 8.5x more actively managed percentage of AUM than the general ETF universe.
Be Smart centers on factor-based ETFs, or smart beta, which tilt toward factors such as value, momentum, and size. This is another way for our firm to diverge from broad, market-cap-weighted ETFs, where it is most prudent. To that extent, CLS has more than twice as much AUM in smart beta and less than half as much in market-cap-weighted ETFs as the overall ETF universe.
The CLS ETF Dashboard has other helpful features, including a breakdown of changes in ETF costs, which we will highlight in an upcoming article.
0350-CLS-4/1/2019
This article was written by Rusty Vanneman, CFA, CMT, Chief Investment Officer and Dustin Dorhout, Research Analyst, CLS Investments, a participant in the ETF Strategist Channel.
