
By John Davi, Nicholas Cerbone, Frank Tedesco, Pankah Patel, Amit Dugar and Michael Stulic
We like to acknowledge the efforts of Will Pham in producing this report.
Our High Conviction Views
Big picture
- Equity risk premium are at 20-year
- Will earnings peak at some point this year?
- Will 493 earnings grow faster than Mag7?
- Will AI increase productivity and increase margins for stocks?
- The biggest challenge for portfolios is that the economic recovery has been so much stronger and for longer anyone
- We think the Trump put will have deep & wide The range of possible outcomes is quite wide.
- Astoria likes idiosyncratic bets like banks, real assets, mid-caps, and equal
- Overall portfolio risks feel asymmetrical given wide range of outcomes from policy, economic, and earnings
US rates
- In Dec 2024, the 10-year reached 2% which felt low relative to the economic growth of the US.
- We think the 10 year could rise to 5-5.5% and expect the term structure to
Select investments we favor
- Money center banks where NIMs should expand with deregulation/increase M&A, and We like KBWB.
- Assets sensitive to inflation, data centers, & power
- Increase usage of alternatives to hedge left tail
Earnings
- Tech is expected to drive ~60% of 2024 earnings growth and ~35% of 2025 earnings
- However, by the end of 2025, Mag 7 net income YoY expected to be 19% vs 11% for Very close!
Nobody will believe this, but KBWB is +49% vs +27% for SPY over the past 1 year.
- The sector’s relative forward P/E and price/book ratios are not extended (both in the ~50th percentile going back 20 years).
- Fundamentally the stars were aligned before Trump’s election
- Large-cap money centers make up Its one of our 10 ETFs for 2025. Click here to read the report
- Banks are cheap and have a regulatory
Fixed Income
- We don’t love FID in We think long term debt cycle poses systemic risk for 60/40 portfolios.
- We think bond portfolios should be tactical as rates can move with wide variance and with inflation proving to be
- Credit spreads are very tight.
- We like Mortgage Backed Spreads are approx. 129bps and in the 79% percentile. Contrast that with US IG which is 88bps and 7th percentile.
ETF Statistics at Large
- ETF assets have surpassed $10 trillion in total Equites represent the lion share with over $8 trillion. Fixed Income continues to rapidly grow and has over $1.8 trillion.
- Over 700 new ETFs launched in 2024, with over 500 of those under the active label. Astoria believes active ETFs will gain in popularity if the market rotation away from the Mag 7 gains momentum over a multi-year period.
- Crypto ETFs exploded last Net flows were over $40 bln in year 1. With a pro crypto administration and large wirehouses who have yet to approve the product, its easy to see more inflows in Year 2 than Year 1.
- Watch single stock leverage ETF products. With amply liquidity sloshing around the system and a bull market that continues to run, levered stock ETFs are the one area to watch for irrational exuberance.
- According to Todd Sohn, derivatives-based strategies exploded in both product number and assets in There were almost 300 new funds that use the derivatives market to some capacity. Levered single stock funds, option writing, and structured outcomes are the key areas here.
- Active Fixed Income ETFs ‘quietly’ took in $100 bln of Astoria believes there are large systemic risk with the longer term debt cycle and one needs to be tactical in fixed income. Hence, we believe active fixed income could have a big year from an asset gathering standpoint.
ETFs have surpassed $10 trillion in assets. In recent years, the bulk of the assets have gone into Core US Equity Large-Caps. Has this fueled the Mag 7 fire?

Source: Bloomberg, Strategas. Data as of December 18, 2024
Anytime we see a chart that shows 100-year extremes, one has to be alarmed. GS: Concentration risk via the weight of top 10 largest stocks is at its highest level since 1929.
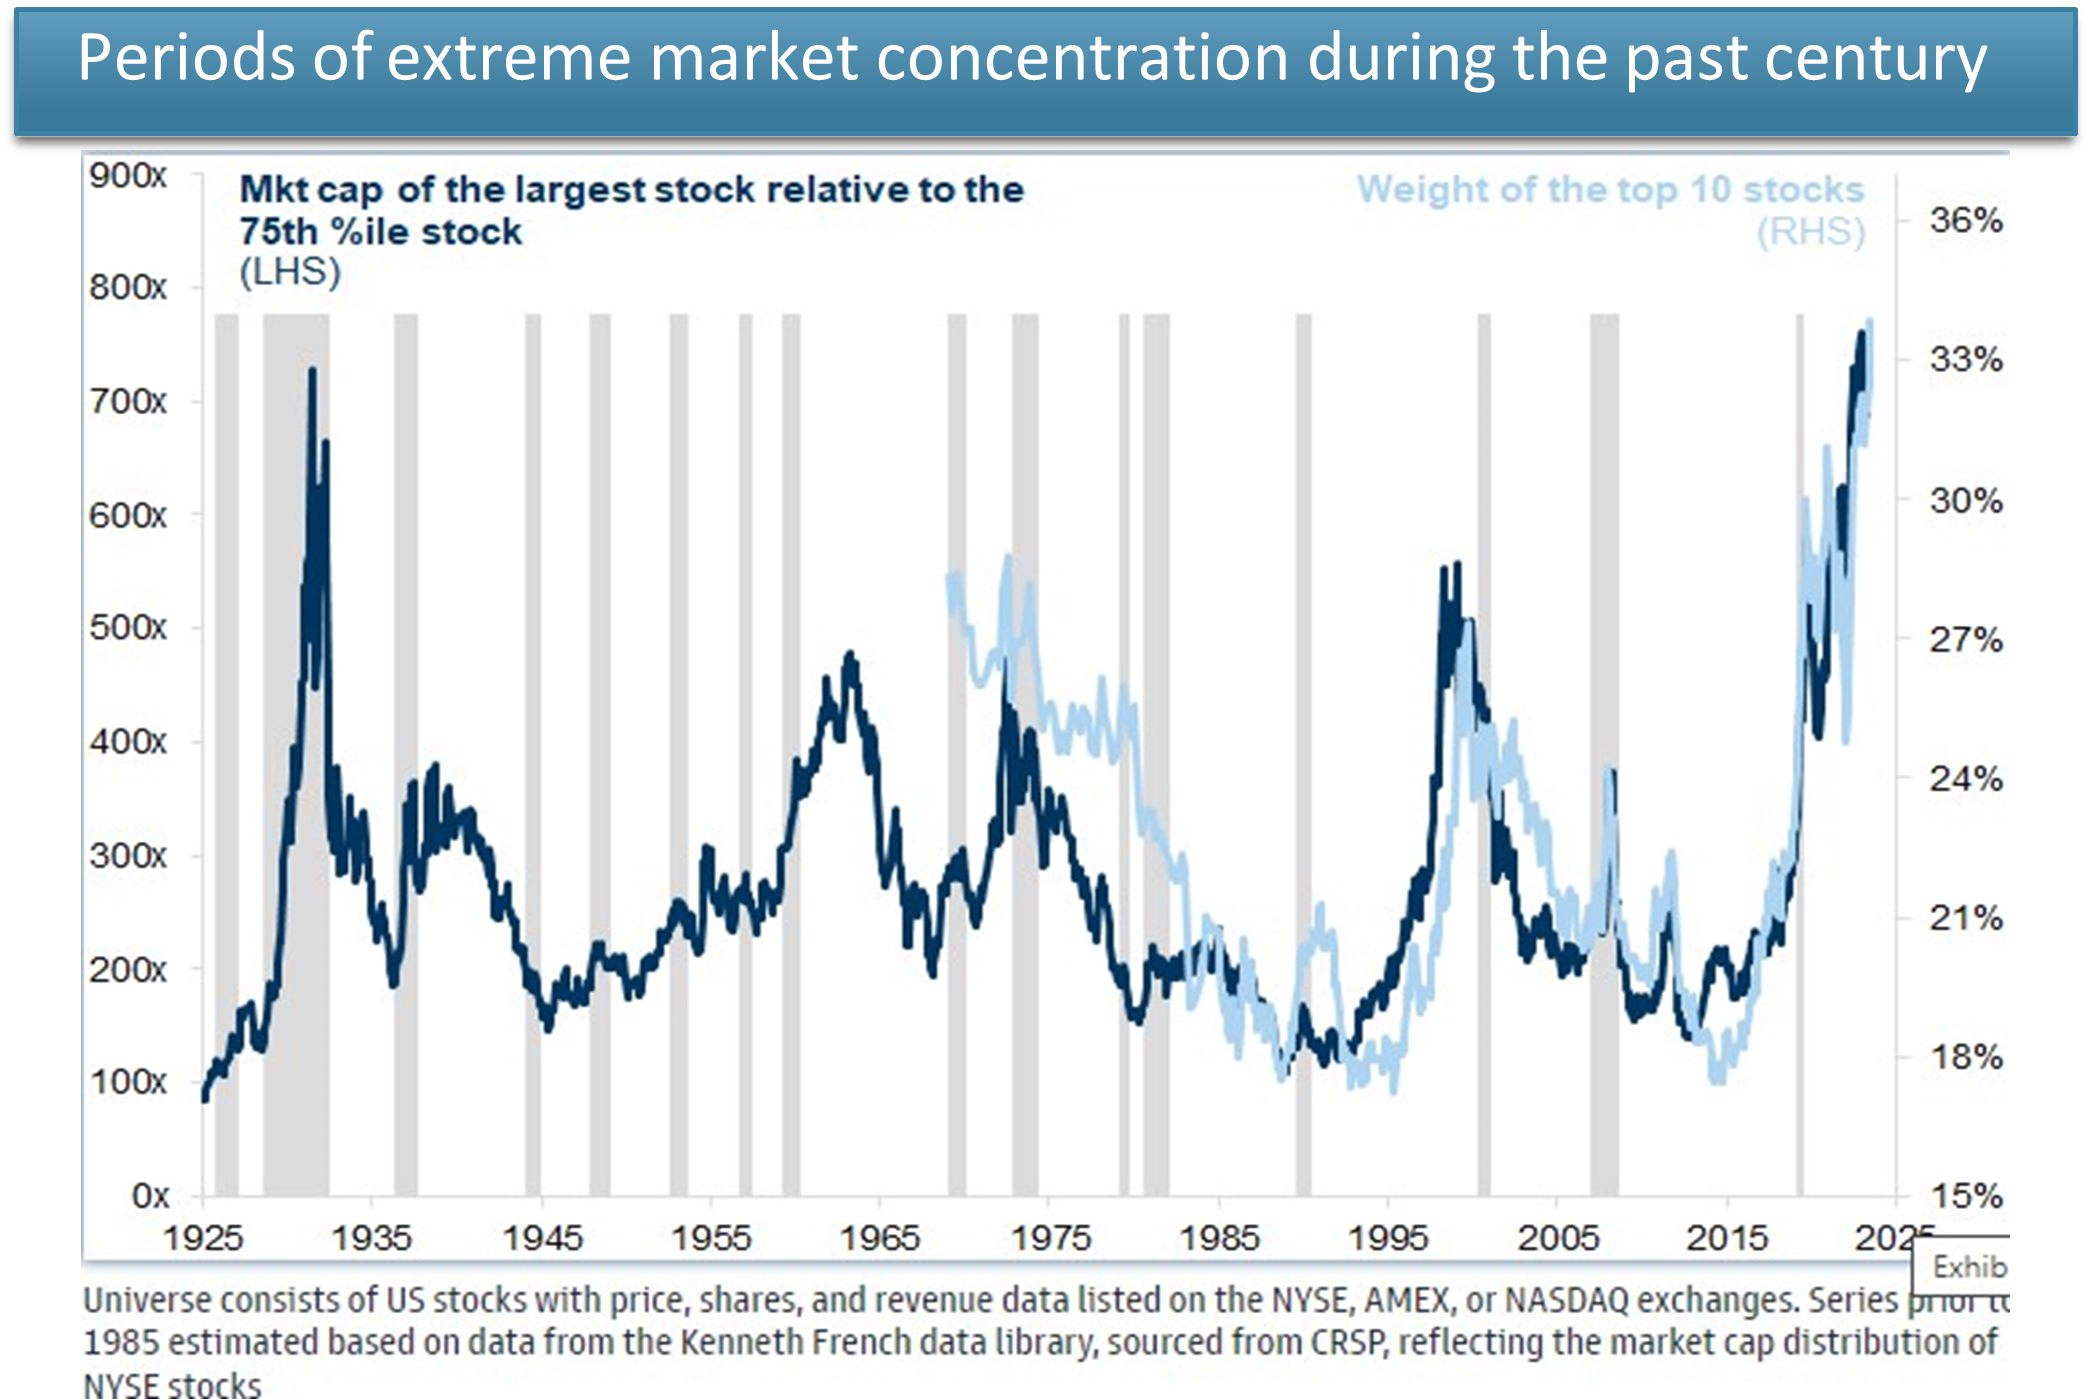
Source: Compustat, SRSP, Kenneth R.French, Bloomberg, Goldman Sachs Global Investment Research. Data as of July 2, 2024
We expect the market will broaden out on the back of relatively stronger earnings growth for the non-Mag 7. Equal-weighted stocks could outperform cap-weighted.
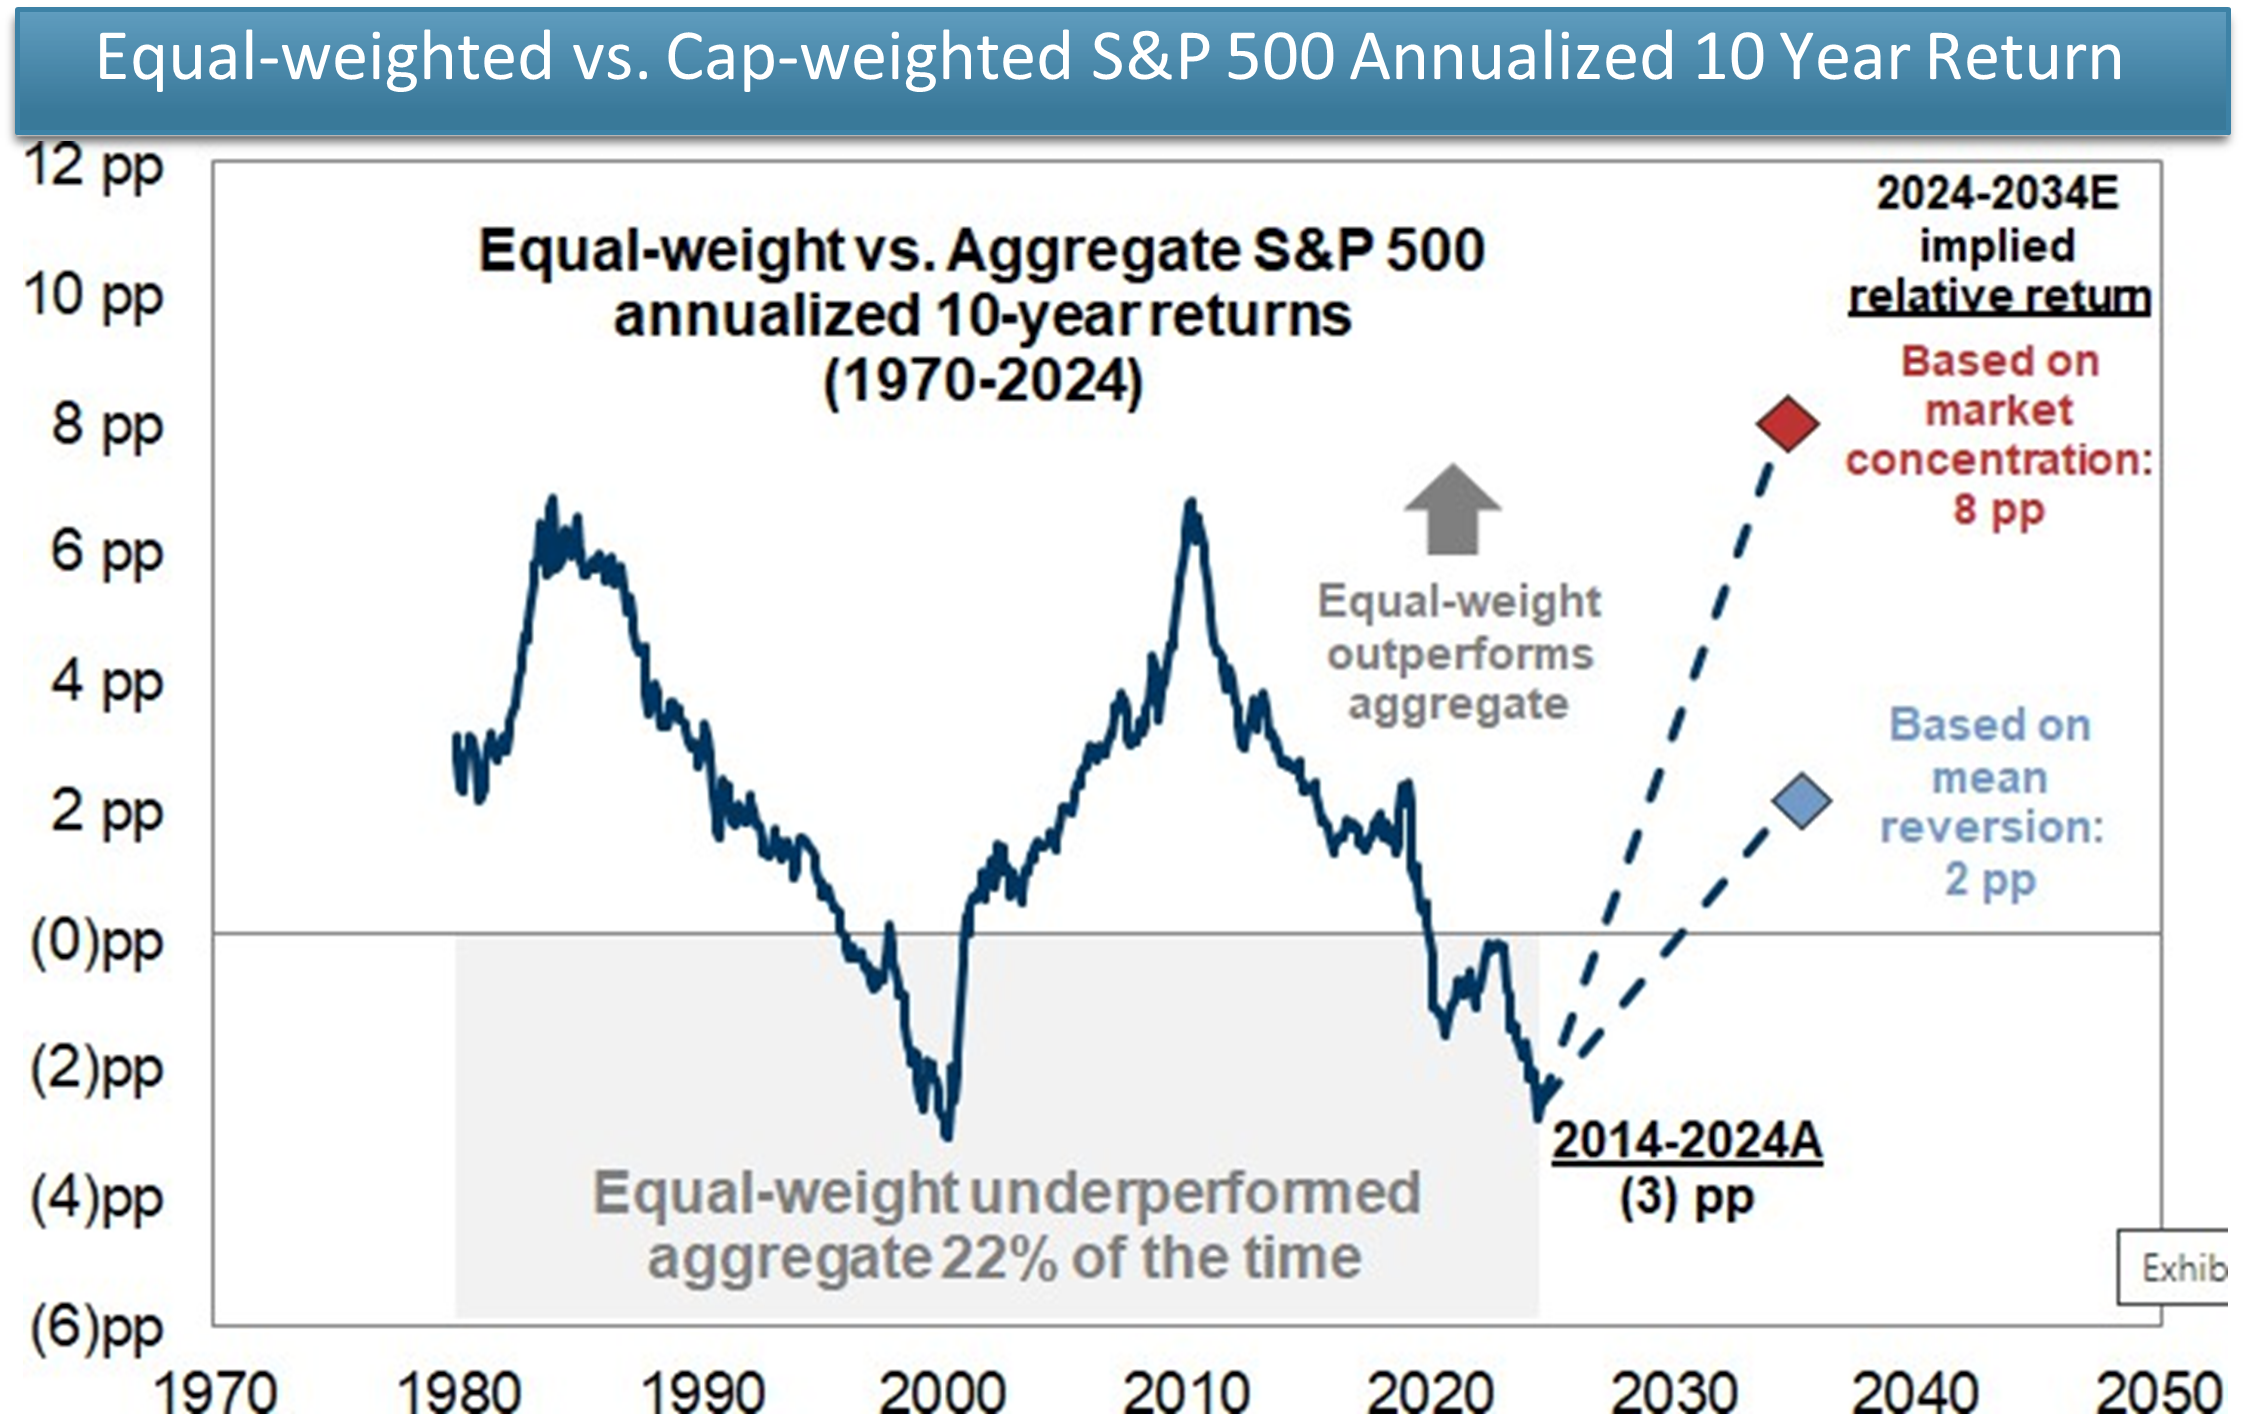
Source: Goldman Sachs Global Investment Research. Data as of November 21, 2024
The reason for the Mag 7 outperformance is justifiable from an earnings standpoint. However, the rate of change (which is what ultimately drives risk assets at the end of the day) has declined while the rate of change for the 493 will marginally increase.
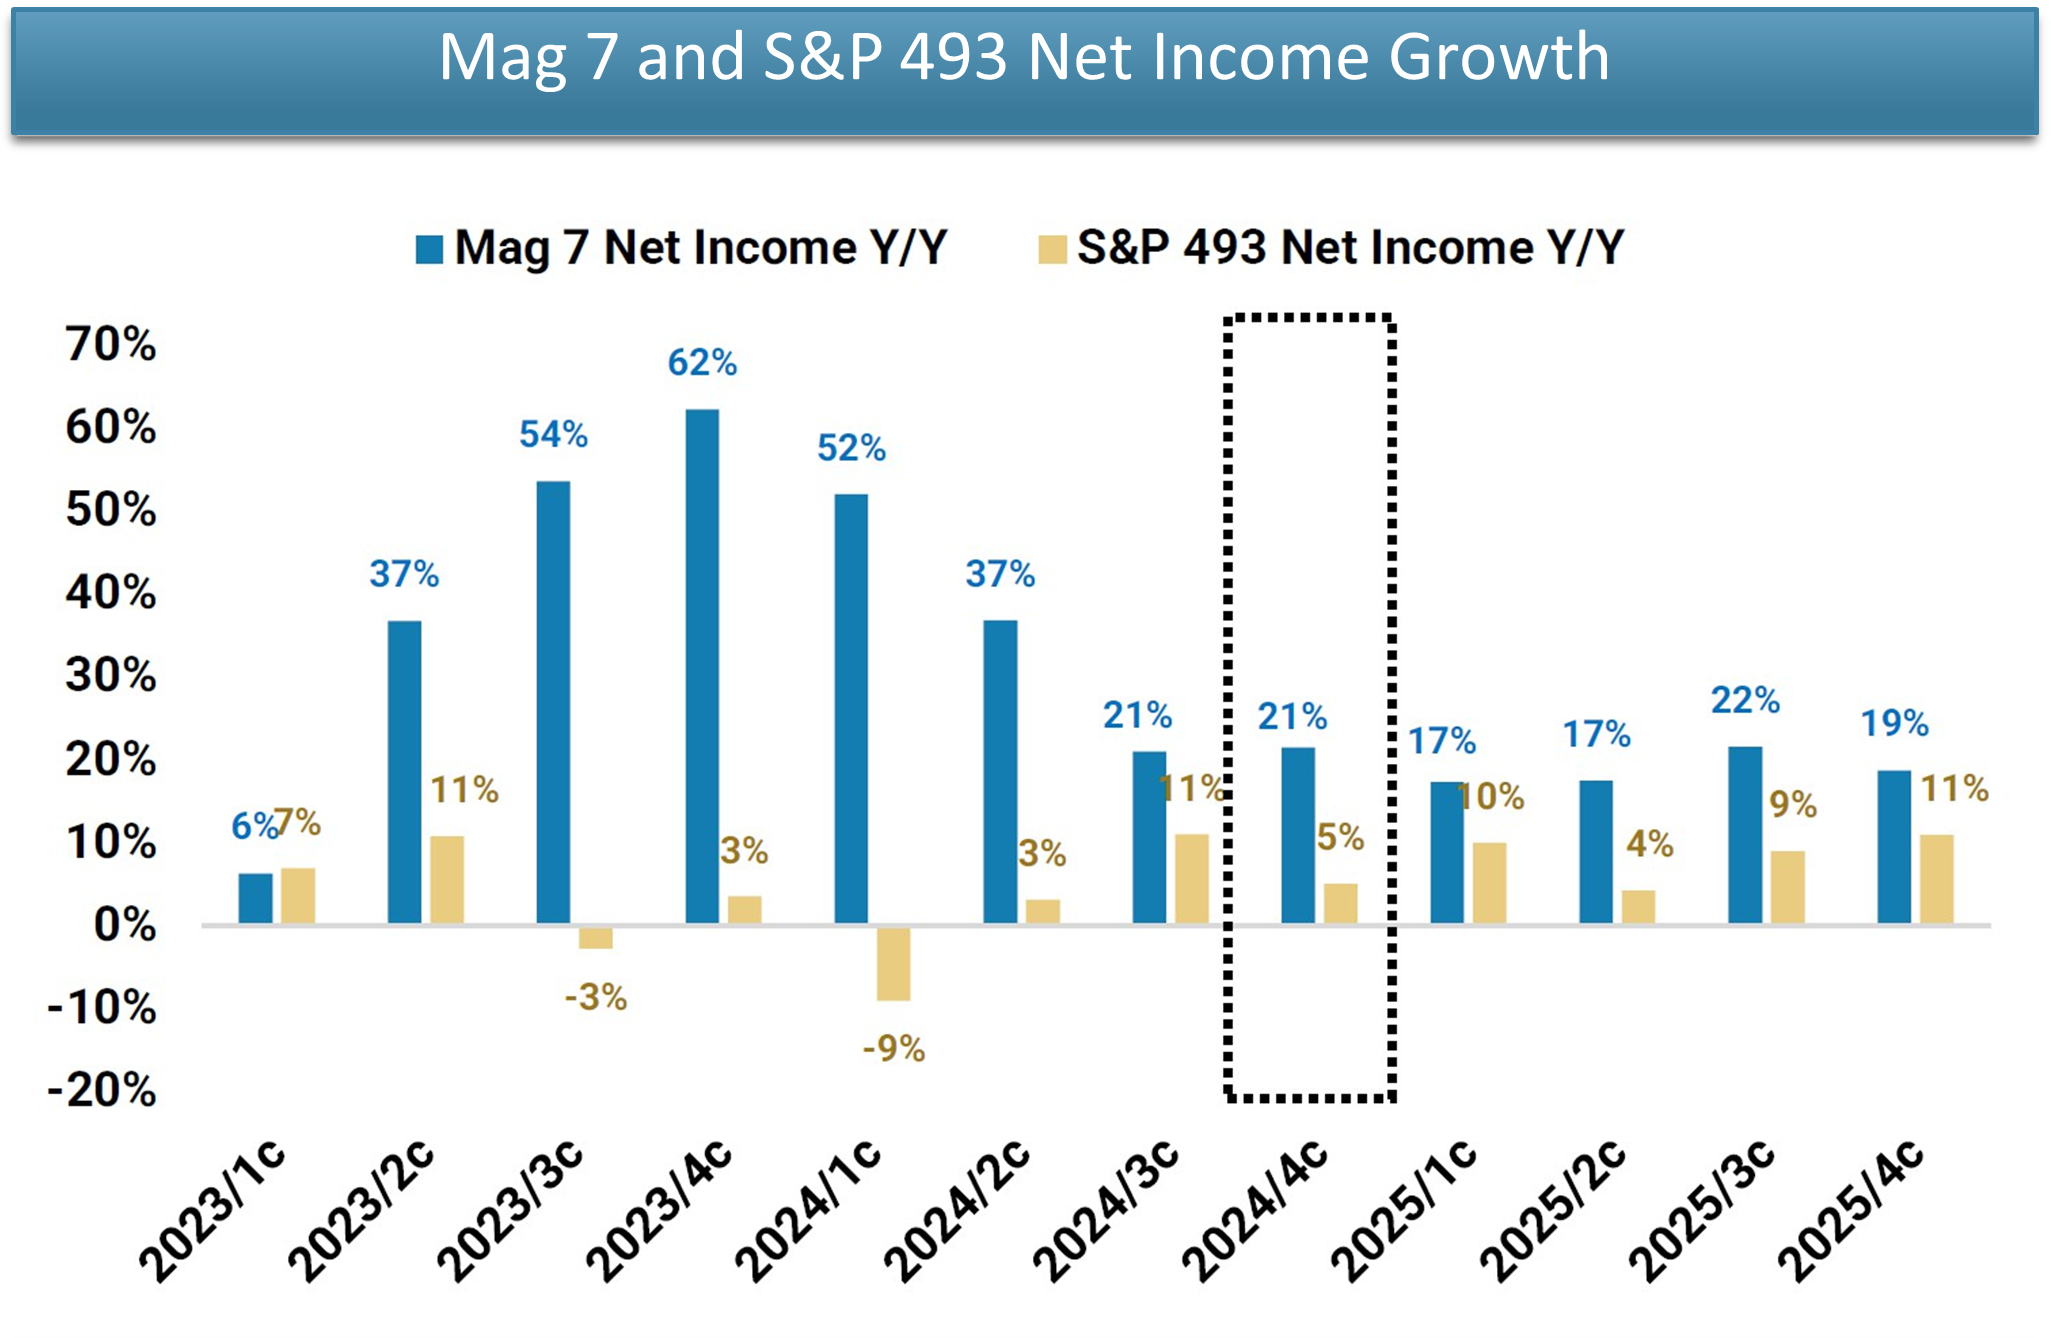
Source: FactSet, Morgan Stanley Research. Data as of January 21, 2025
We are NOT saying to sell Mag 7. We simply think portfolios should cap their weights. That is what Astoria does for our quantitative stock portfolios.
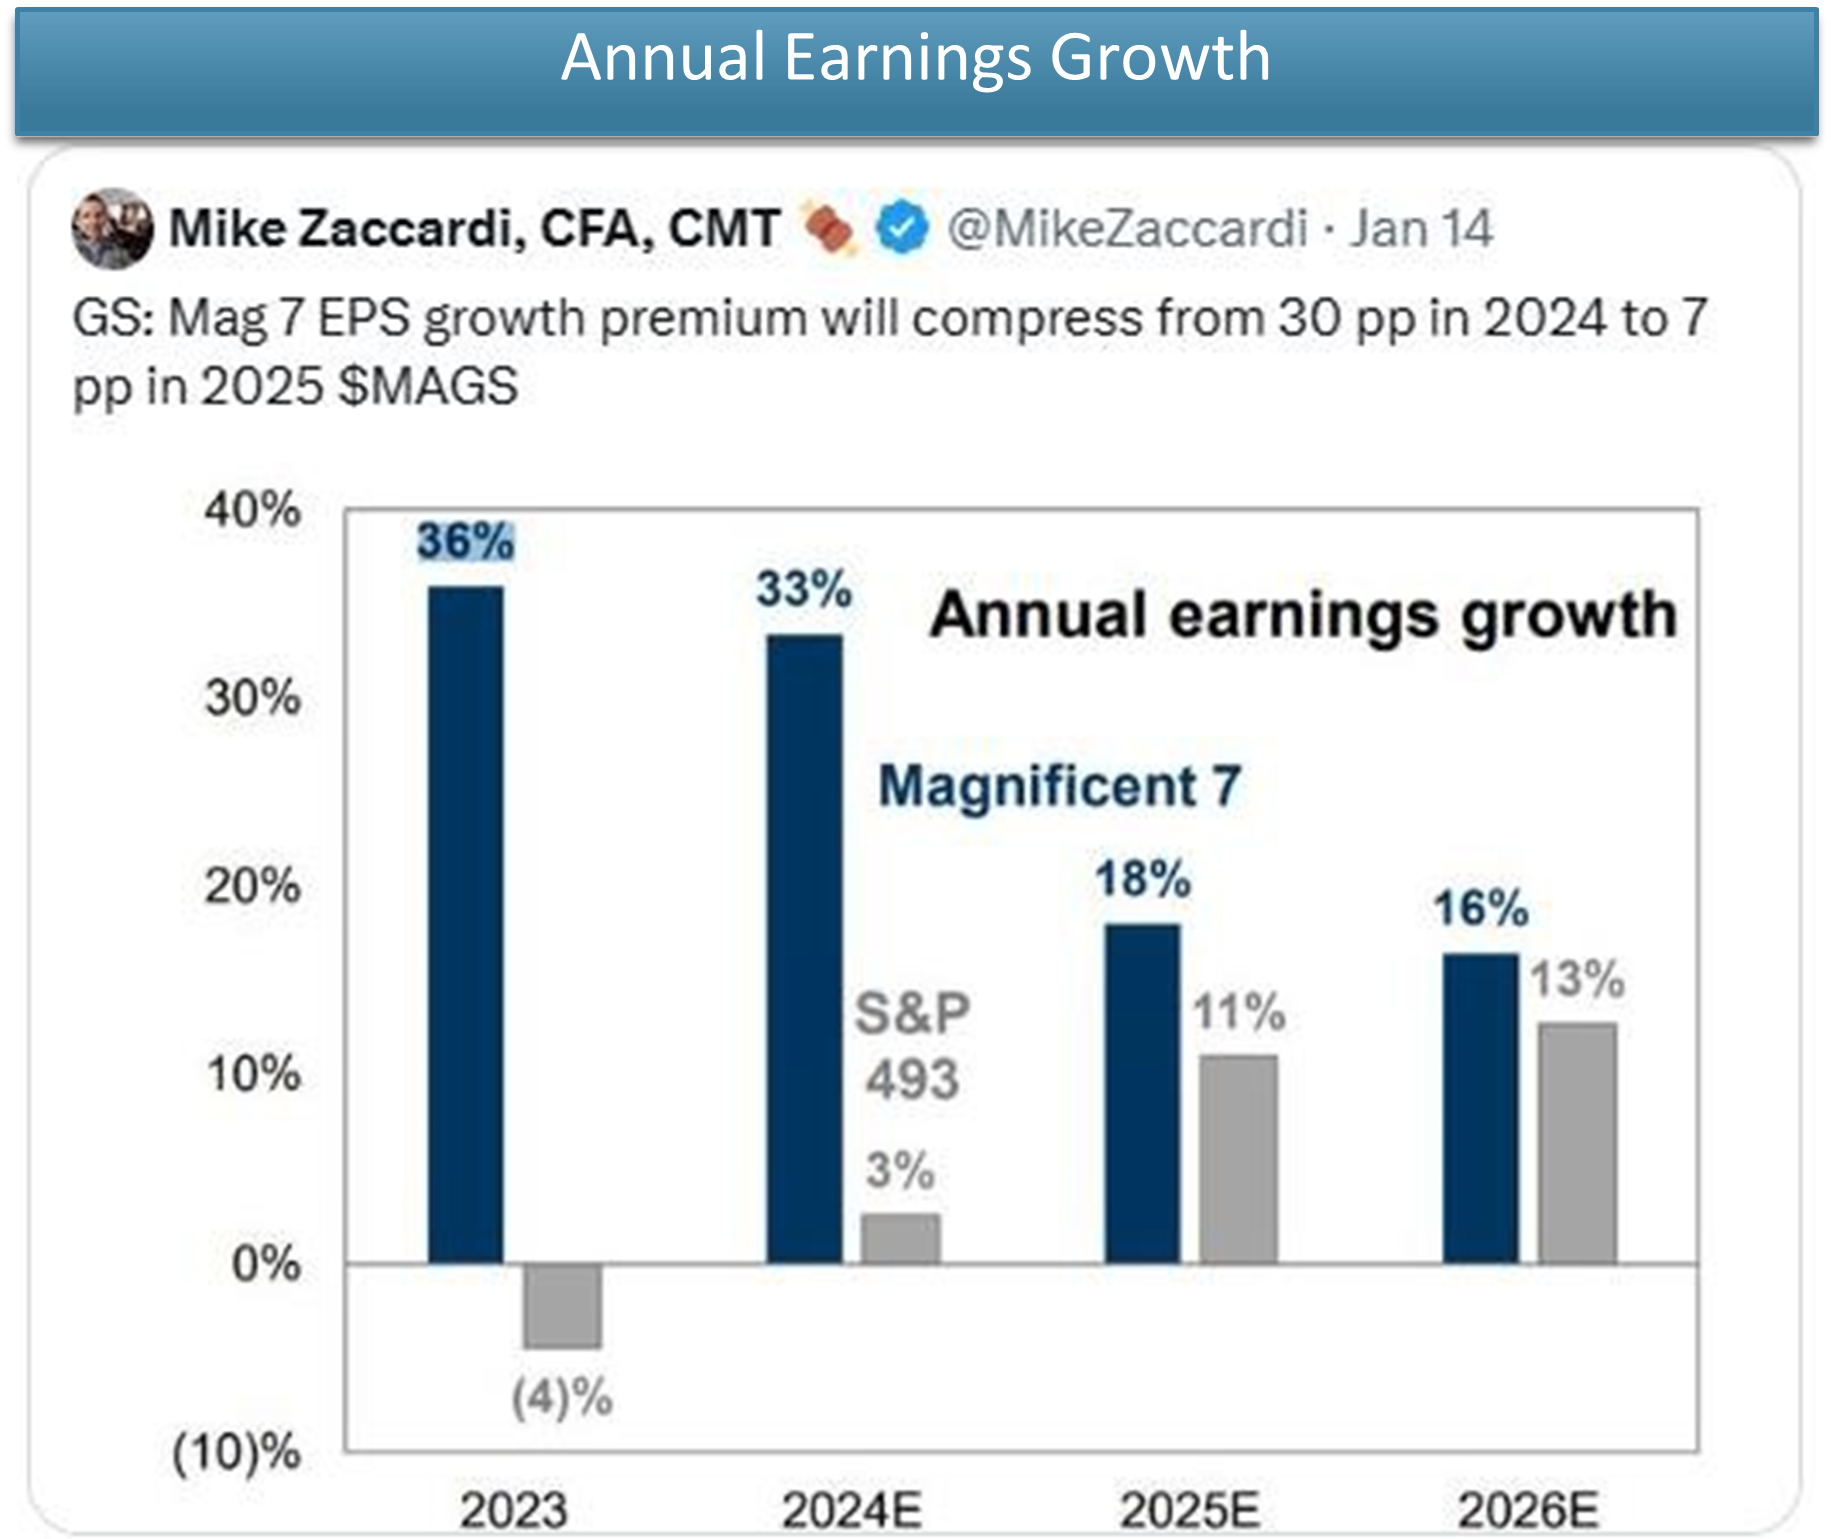
Twitter Source: Mike Zaccardi’s post as of January 14, 2025
Data Source: Goldman Sachs
The largest stocks in the S&P 500 do not usually stay at the top, yet individual stock holders believe in path dependency. Consider a 351 exchange?
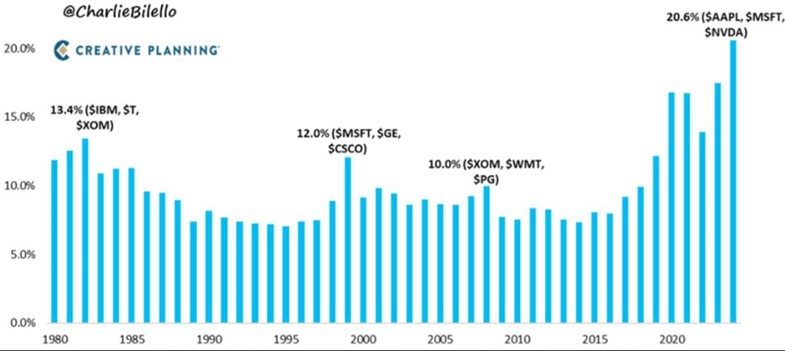
Source S&P Dow Jones, Ycharts, Creative Planning, and Charlie Bilello’s Twitter. Data as of December 20, 2024
Over 700 new ETFs launched in 2024, with over 500 of those under the active label. If the market broadens out and Mag 7 relatively underperform, we’d expect more product proliferation in this space and the pace of inflows to continue.
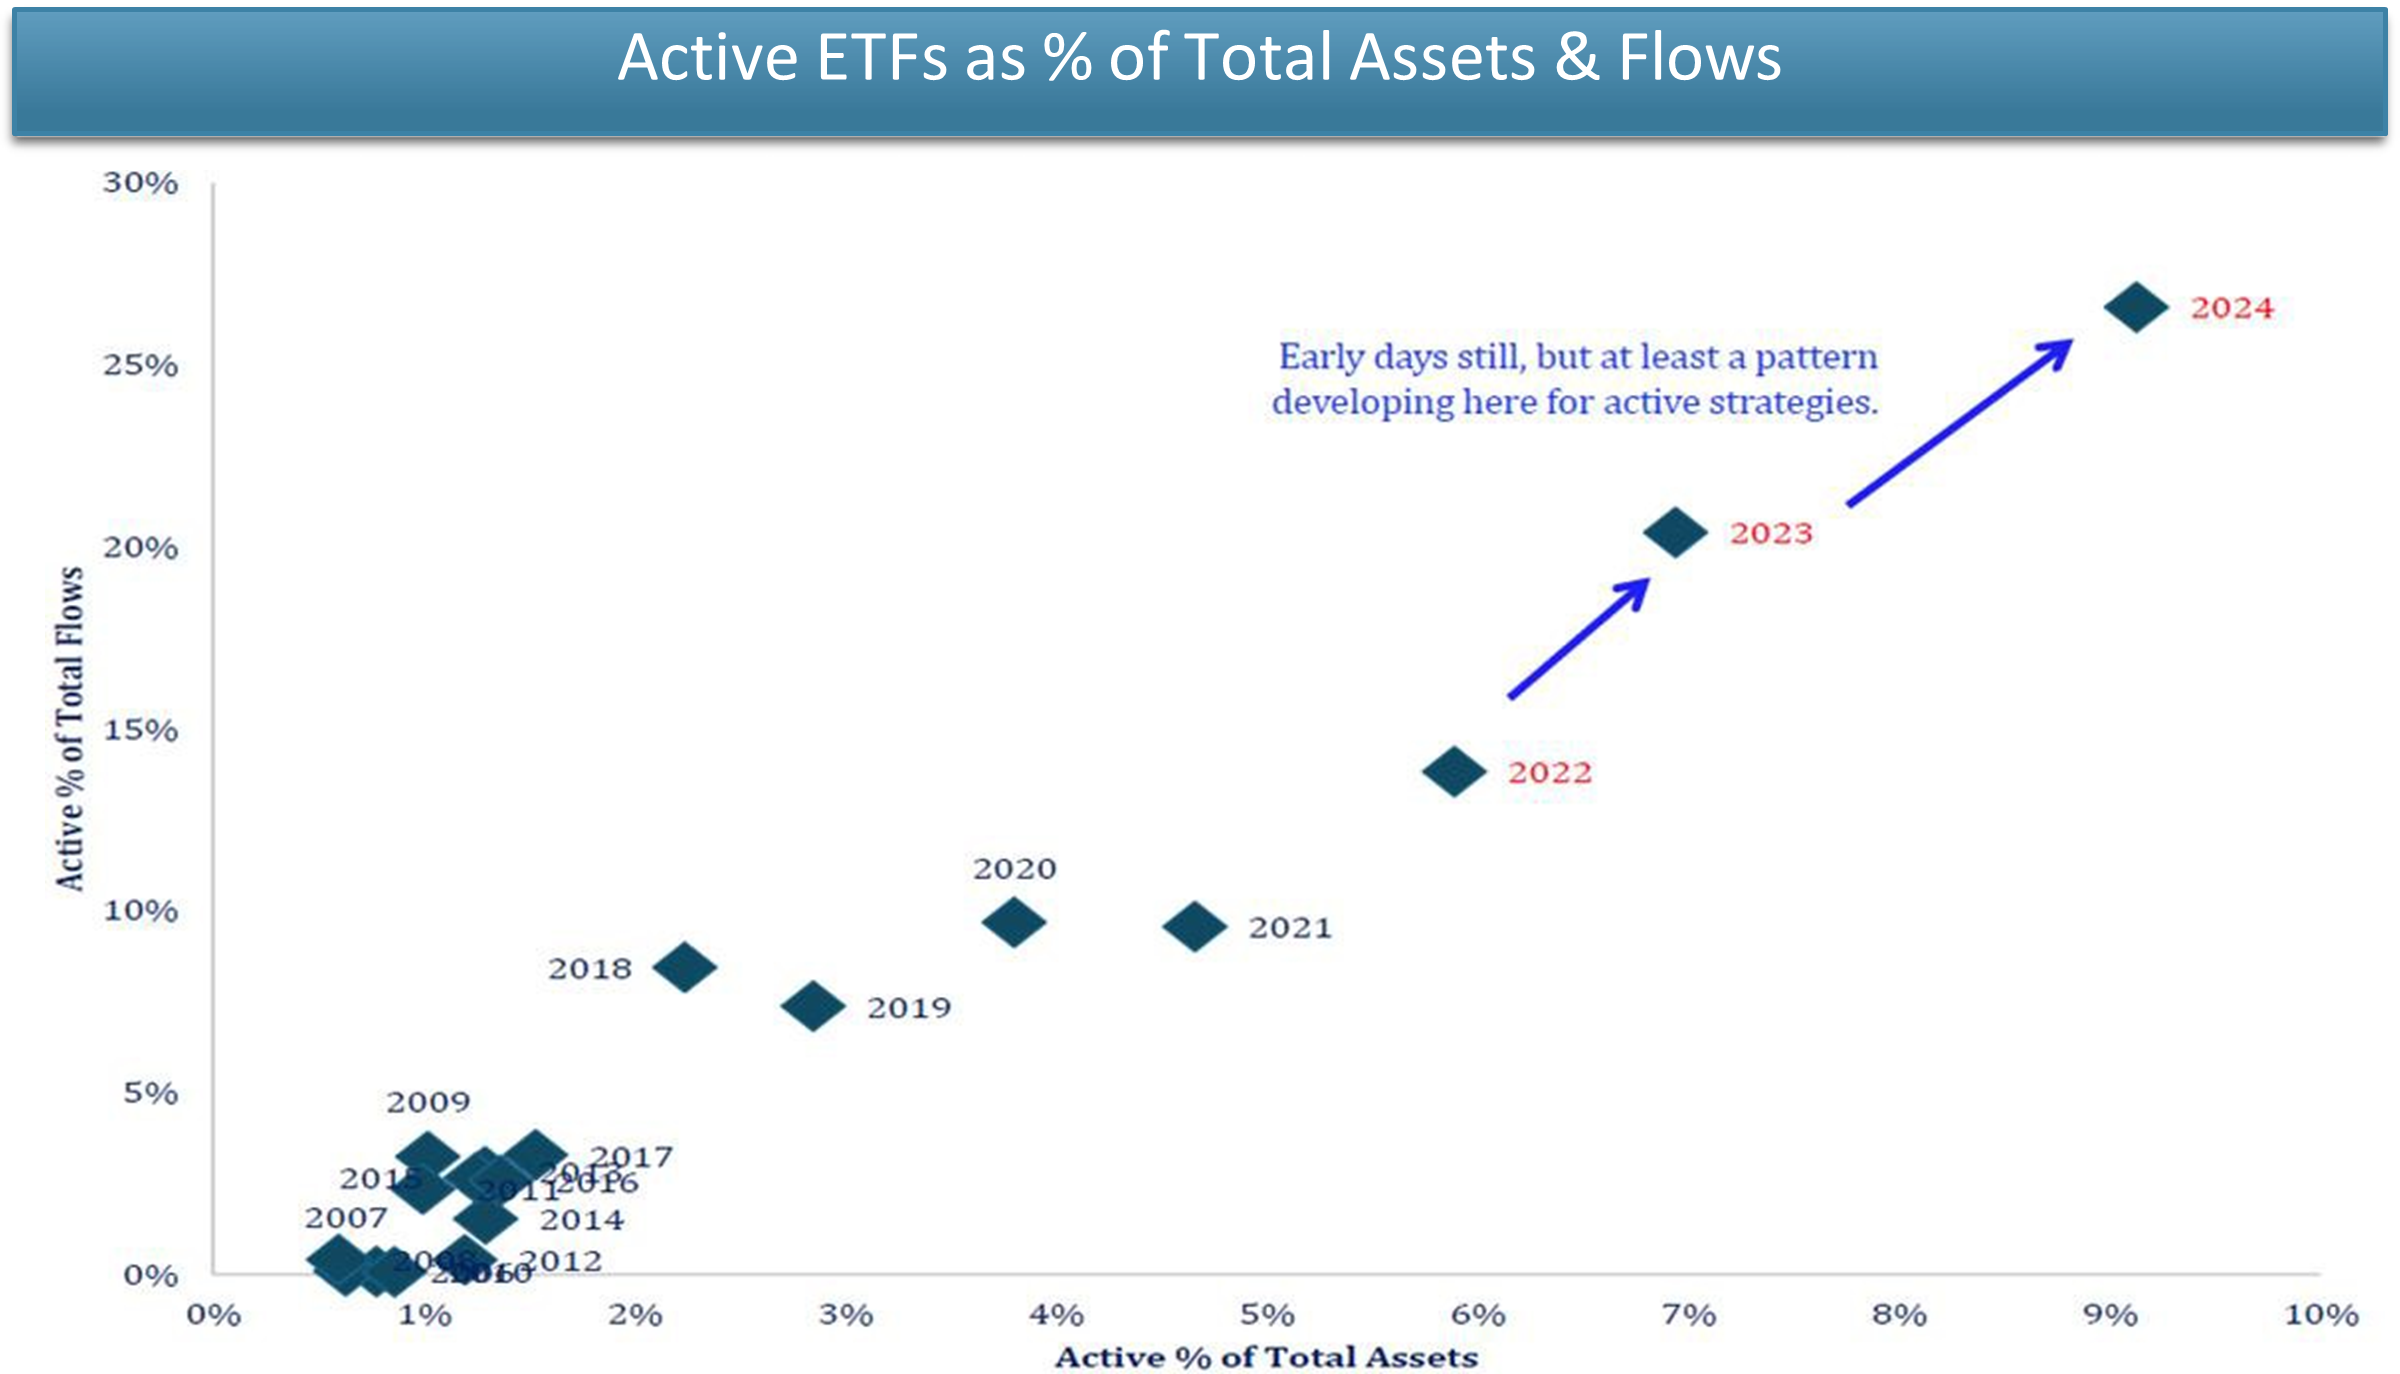
Source: Strategas, ETF Action. Data as of December 18, 2024
The Mag 7 have surpassed all other recent post World War Manias.
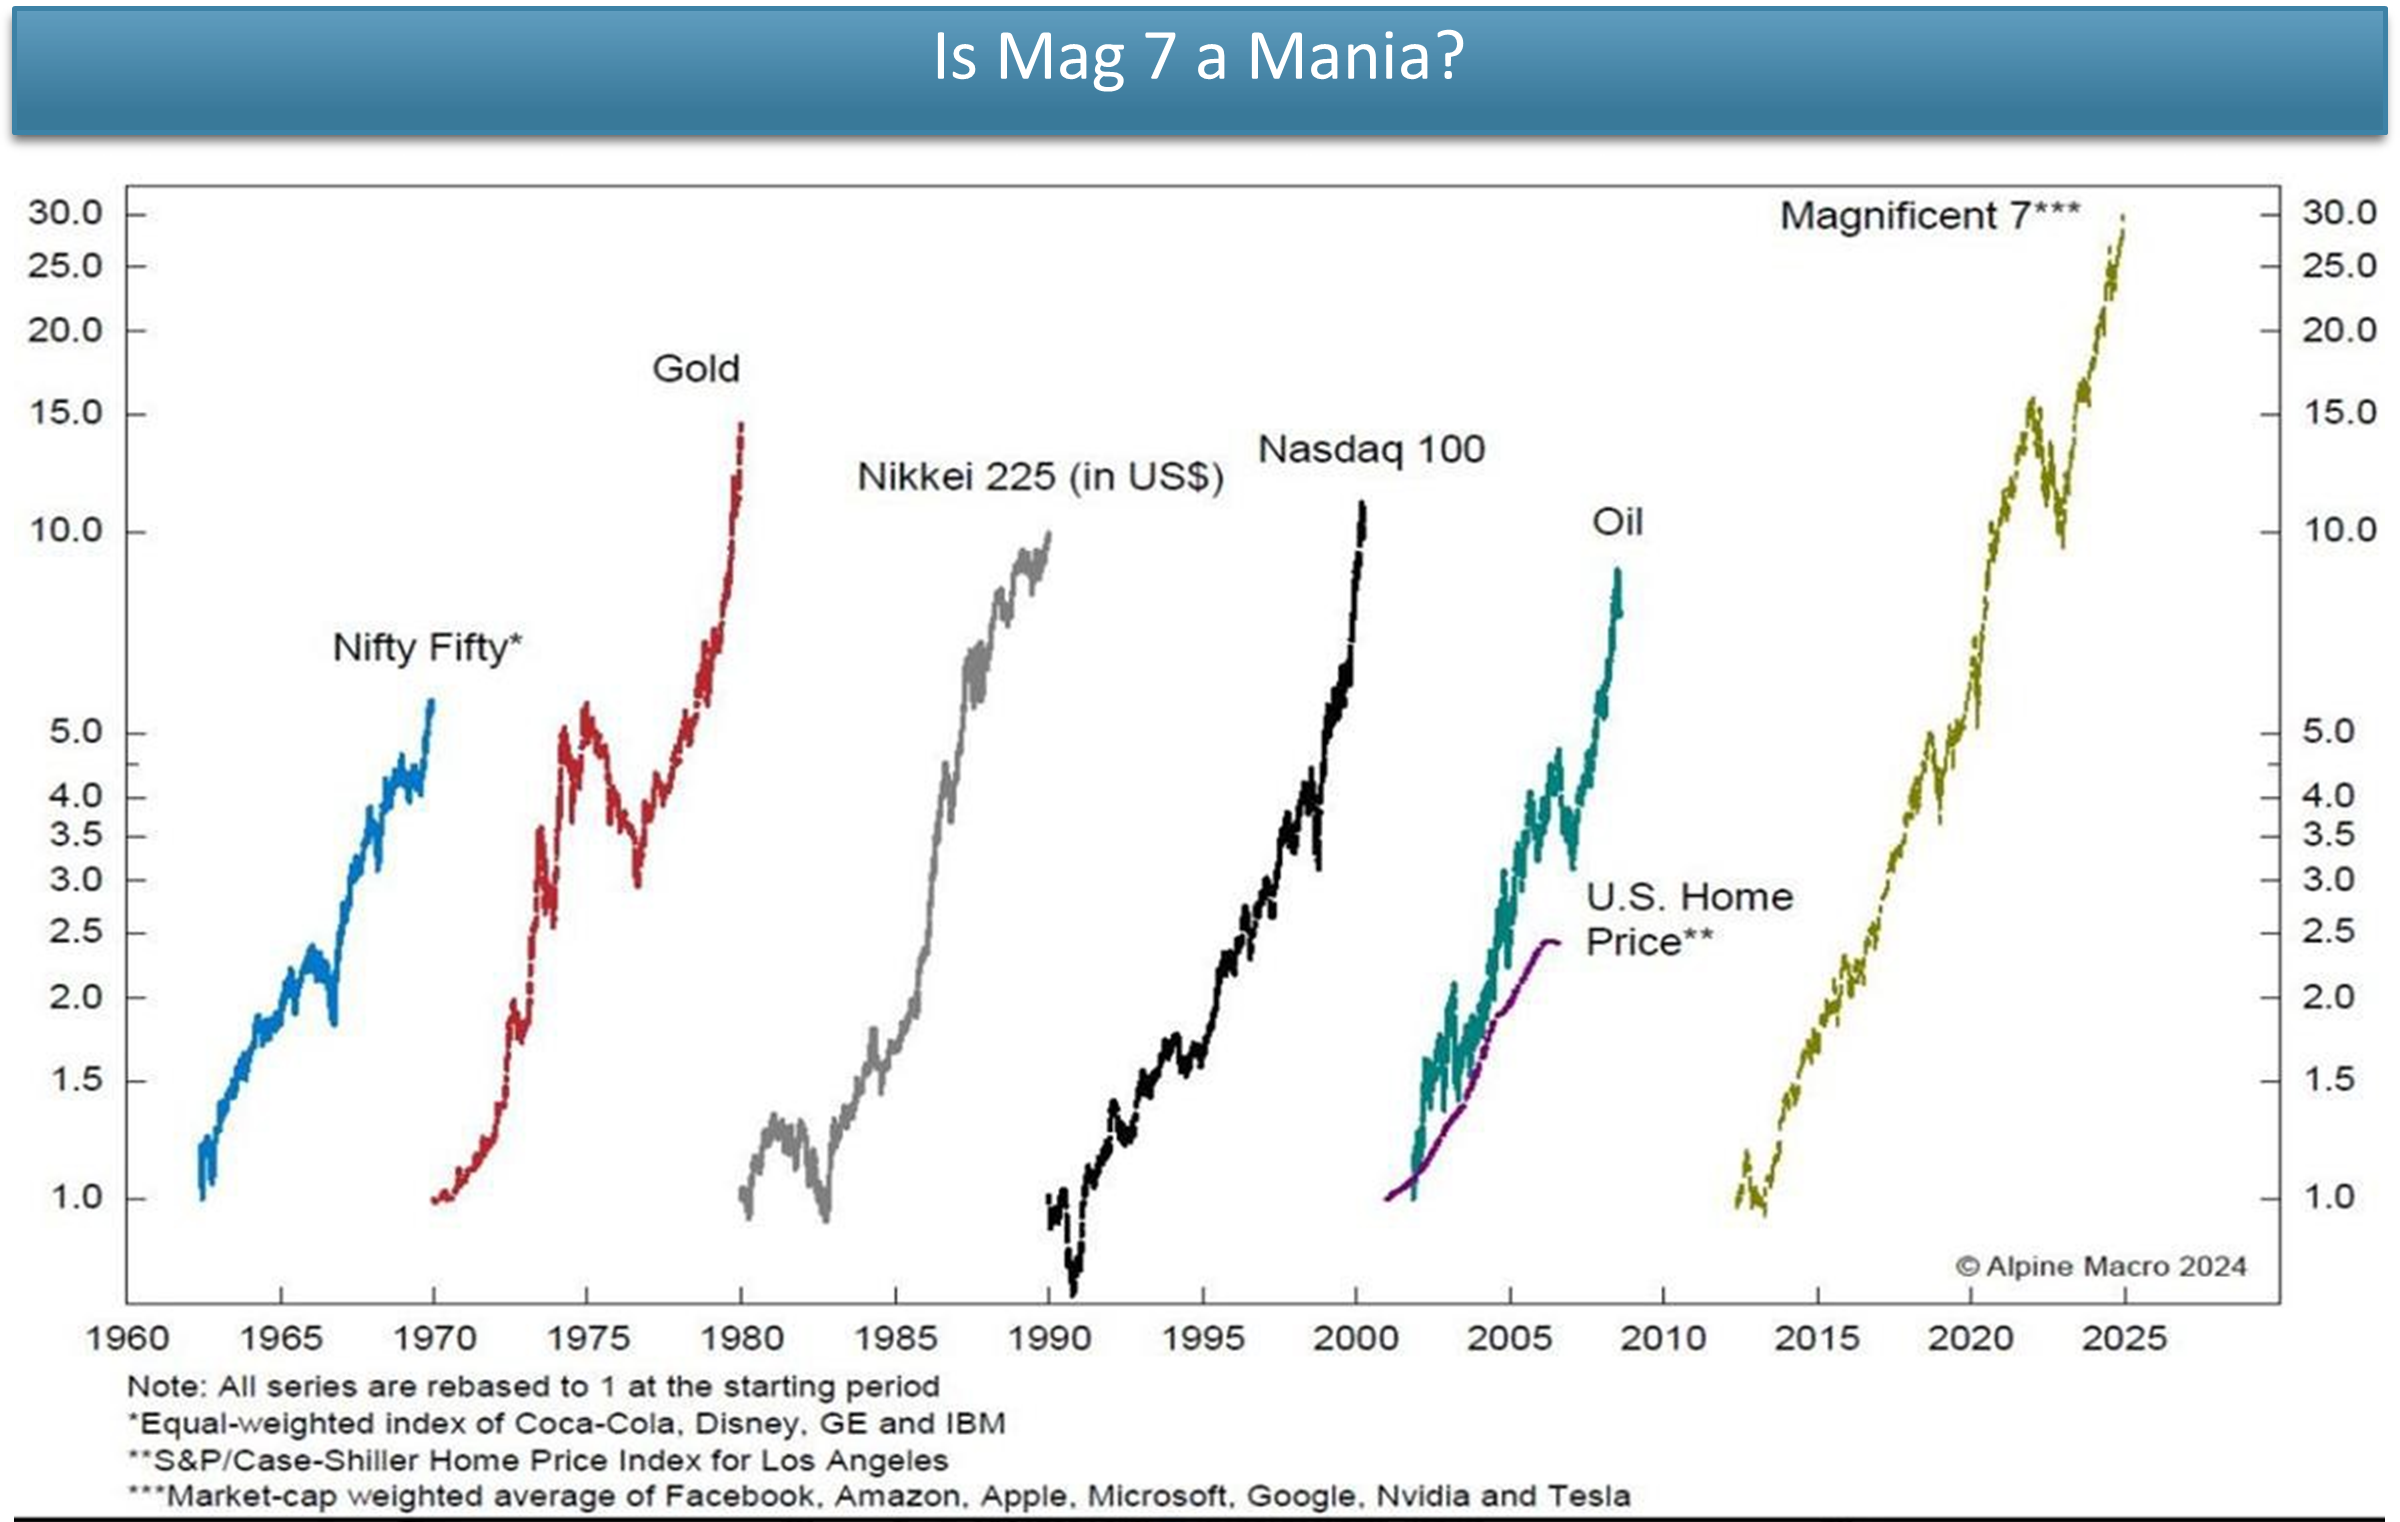
Source: Alpine Macro. Data as of 2024
Bitcoin, cyclicals, real assets, and liquidity sensitive assets are picking up on M2 money supply increasing.

Source: Federal Reserve Board, National Bureau of Economic Research Bravos Research. Data as of January 11, 2025
The 1970s CPI analogy remains intact. As followers of our research know, this was our big call years ago.We launched our inflation hedging strategies in June 2020 with our GIPS composite starting in Nov 2020.
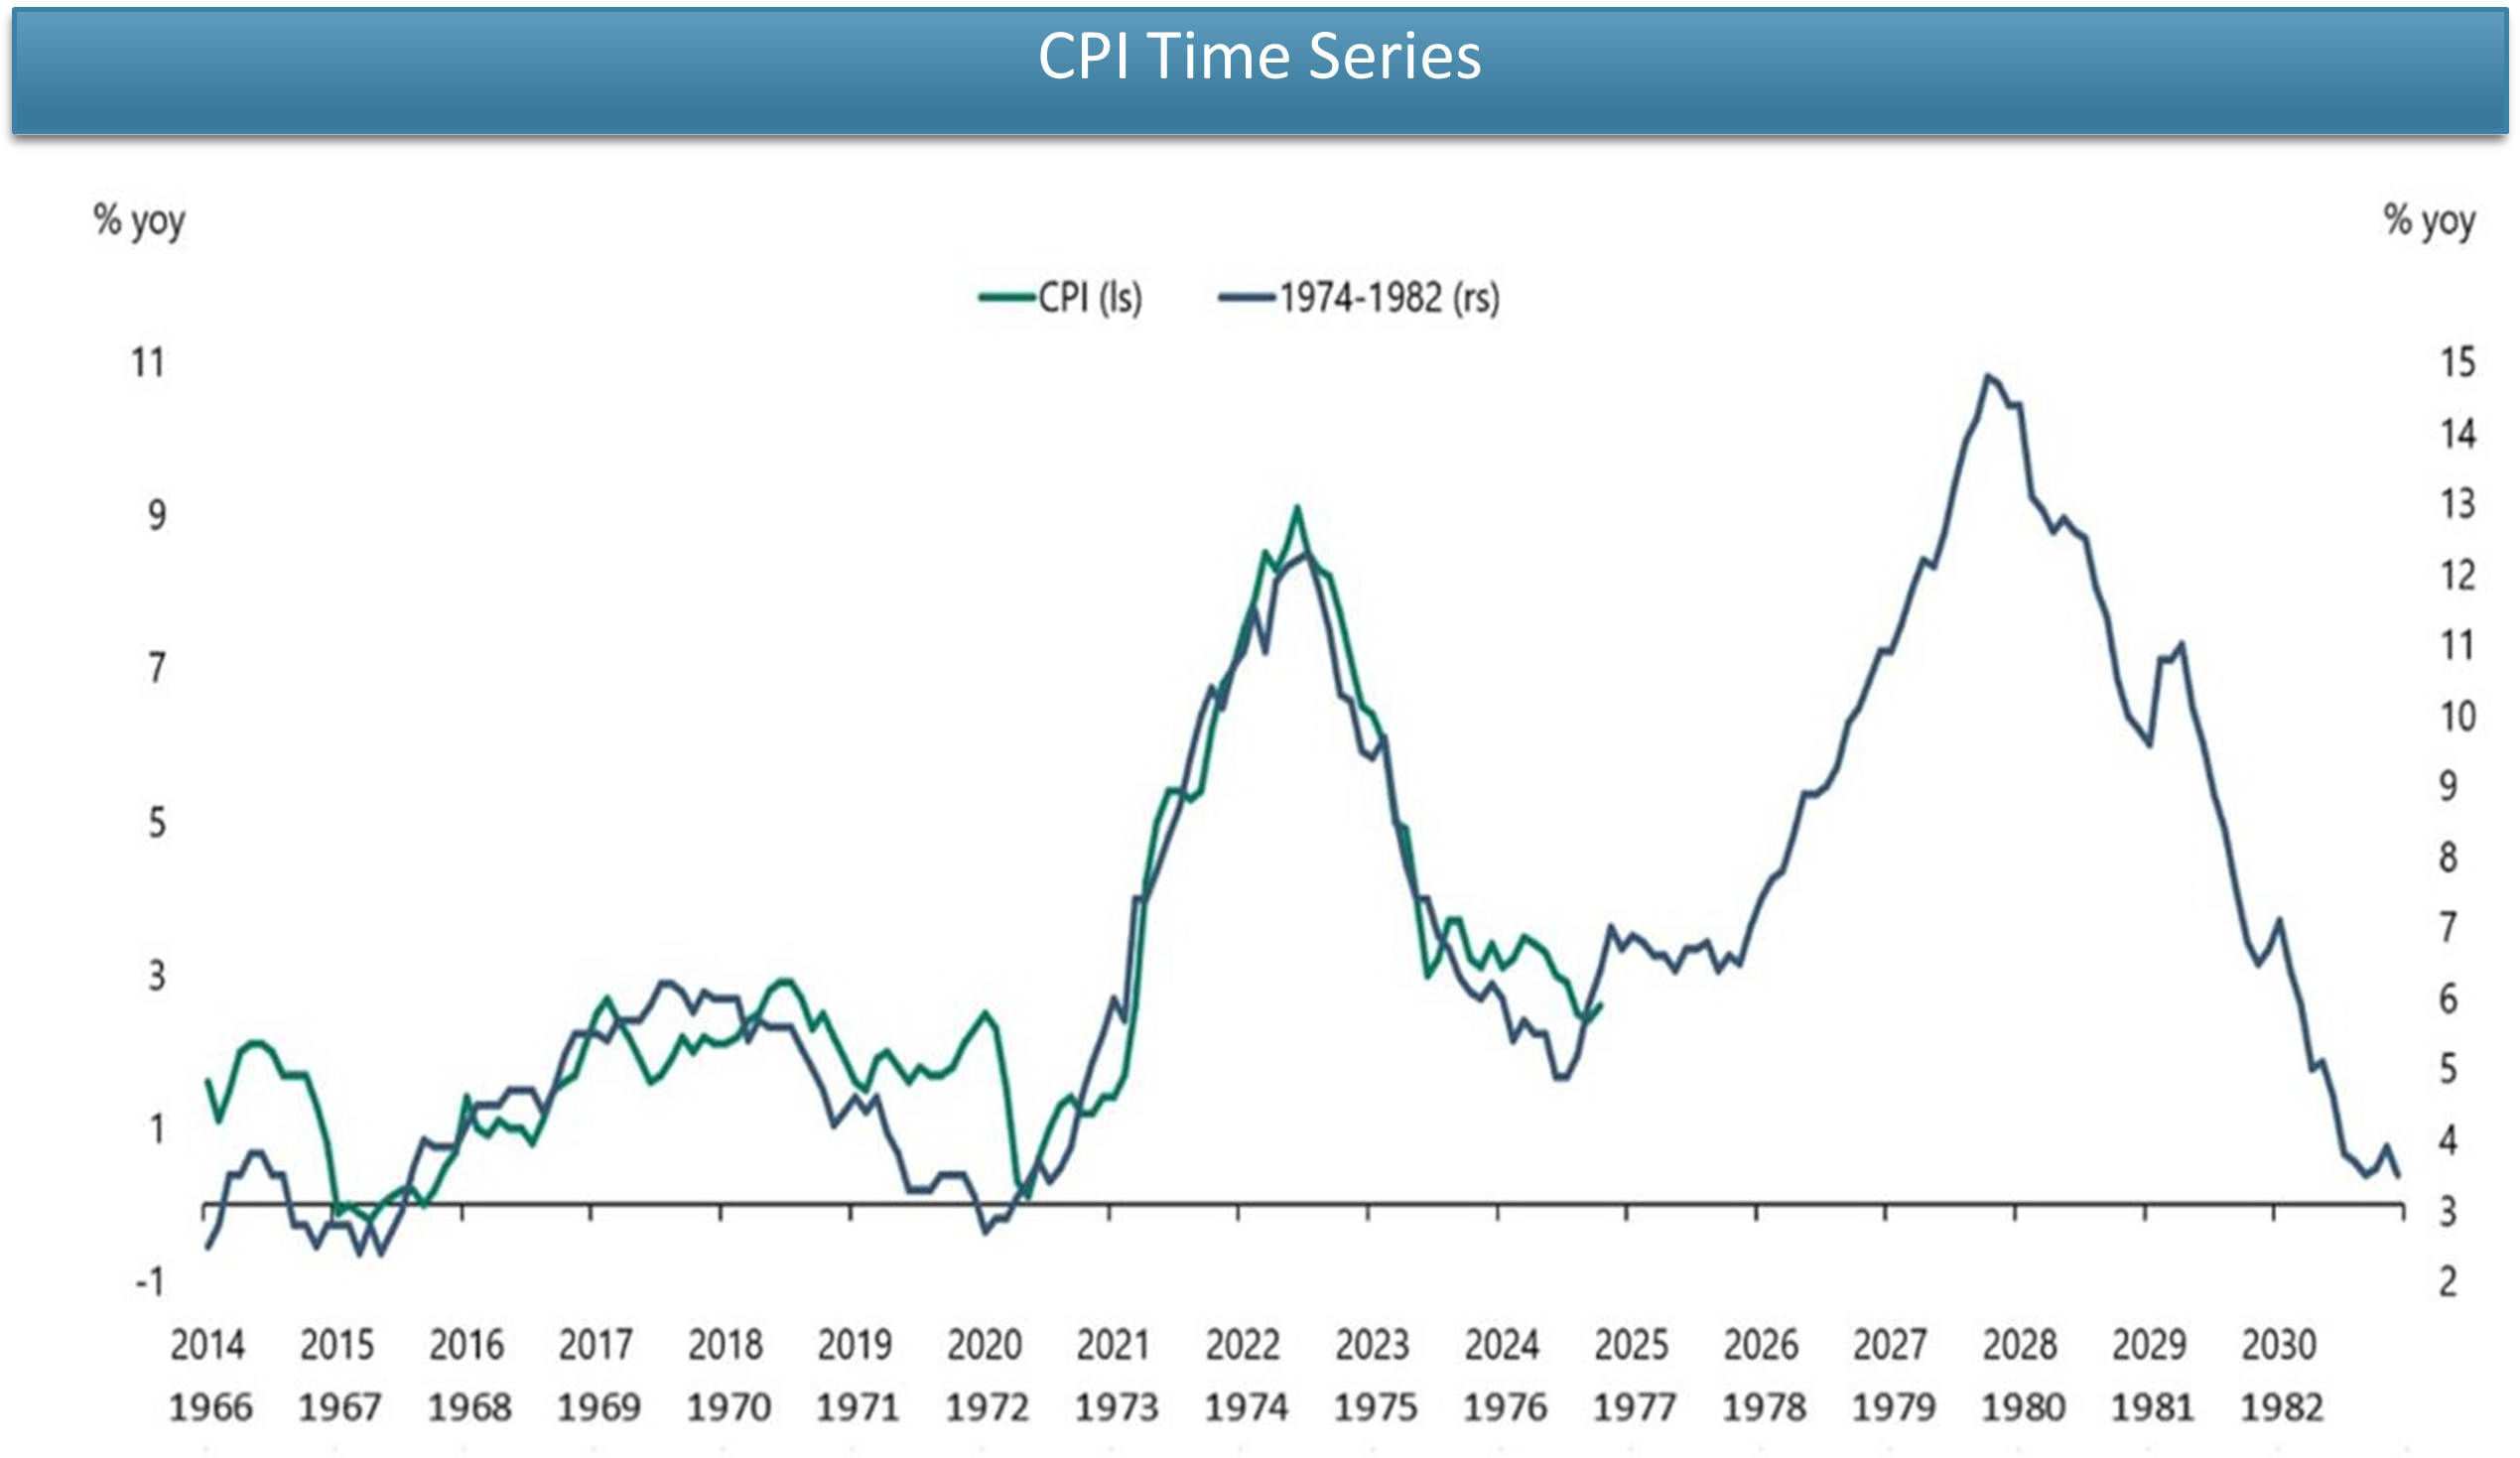
Source: BLS, Apollo Chief Economist. Data as of January 2025
A Cookie and Tea at Panera Bread costs over $8 (in Queens, NY). Main Street Inflation is getting worse – not better. Why not hedge your portfolio with real assets which are trading at a discount to SPX?
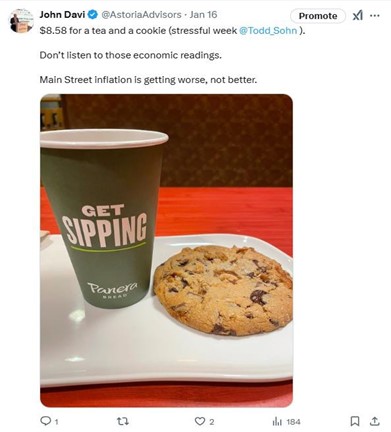
Source: John Davi’s Twitter. Post as of January 16, 2025
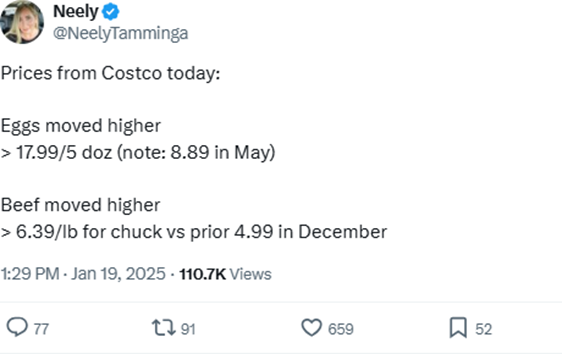
Source: Neely Tamminga’s Twitter. Post as of January 19, 2025
Small-cap earnings are expected to surpass large-cap earnings in 2H25. Using a median multiple, small-caps trade in the bottom 35th percentile, while large-caps trade in the top decile. Nonetheless, there is very little love for small-caps (left chart) despite enthusiasm brewing (right chart).

Twitter Source: Bar Chart. Post as of January 15, 2025
Data Source: Factset, Lipper, BofA US Strategy & Quant Strategy
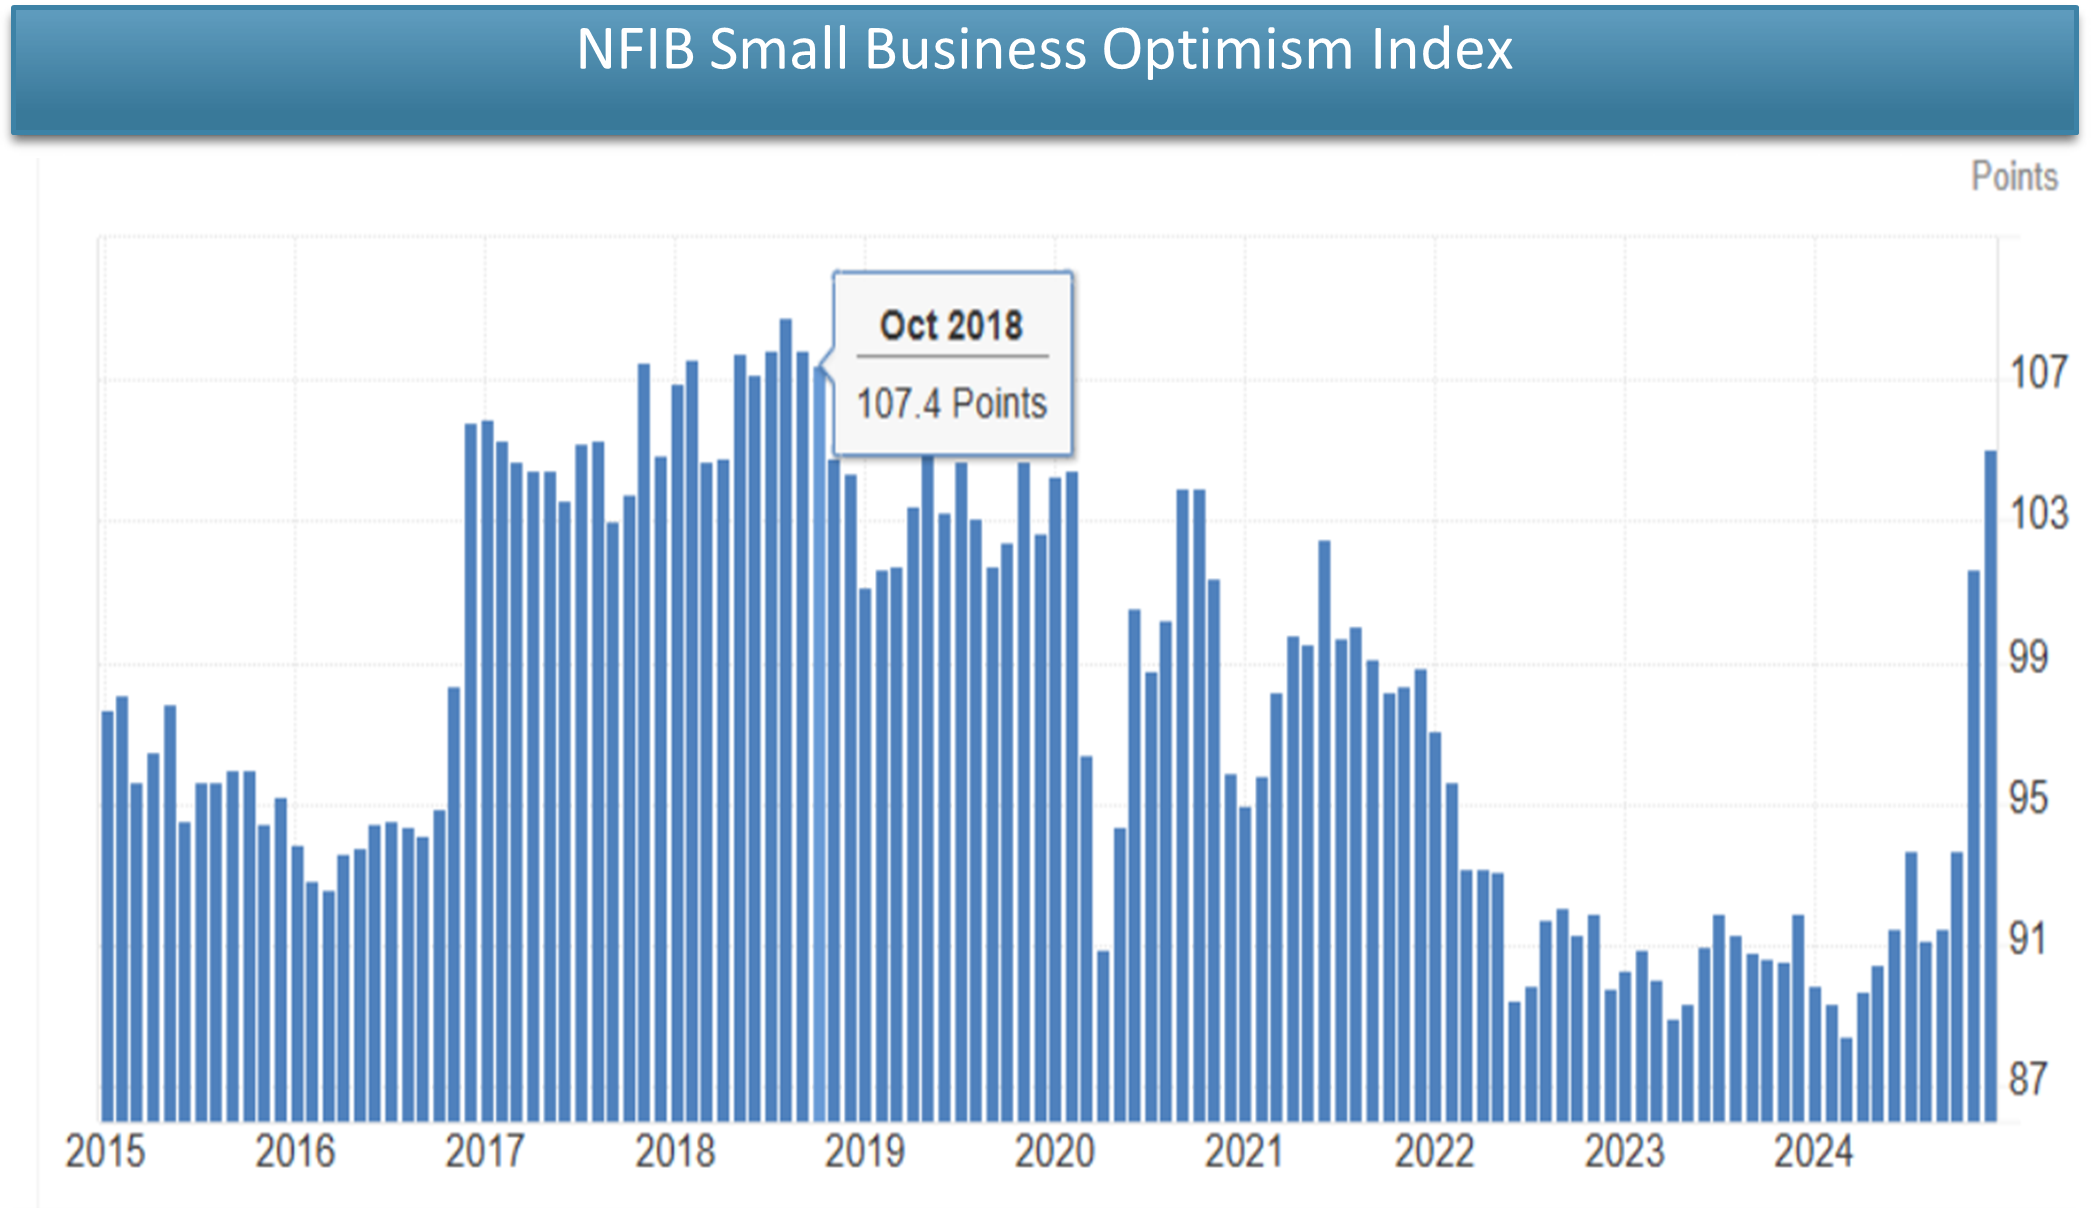
Source: National Federation of Independent Business. Data as of January 15, 2025.
With Trump’s pro-crypto administration, its hard to imagine inflows into bitcoin and other crypto ETFs won’t continue. Bitwise Asset Management expects more inflows into Bitcoin ETFs in Year 2 compared to Year 1.

Source: Bloomberg, Farside Investors, Bureau of Labor Statistics, and Bitwise. Data as of December 6, 2024
When liquidity is flowing and bull markets running, investors have flocked toward leverage. Single stock ETF volumes exploded in 2024 and are expected to increase, per Todd Sohn.
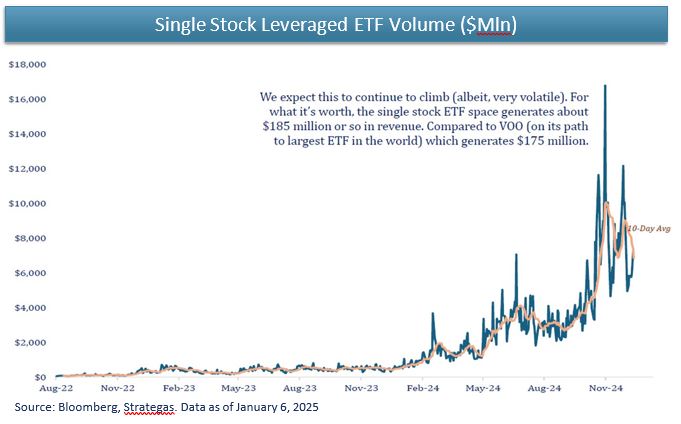
The ETF revolution has ways to go.

Source: Bloomberg Intelligence. Data as of January 14, 2025
Who is Astoria Portfolio Advisors
Who We Are
APA is an SEC registered asset management company headquartered in New York City since 2017.
Investment Philosophy & Approach
Astoria brings institutional caliber investment strategies and utilizes ETFs to build solutions for investors. Our investment discipline is macro and quantitative.
Astoria’s 3 Businesses
- Managing money for financial advisors, RIAs, and family offices
- Sponsoring and managing exchange traded funds (ETFs)
- Managing money for high-net-worth individuals
Astoria is run by a seasoned investment team led by Founder, John Davi. Astoria advises on approximately $2B in assets across equities, fixed income and commodities.
Currently managing over 1,500 client accounts and three ETFs (PPI, ROE, and GQQQ).
For more news, information, and strategy, visit the ETF Strategist Channel.
Warranties & Disclaimers
¡ Disclaimers | Not FDIC/NCUA Insured | Not a Deposit | May Lose Value | No Bank Guarantee | Not Insured | Past Performance is Not Indicative of Future Returns
- As of the time of this writing, Astoria held positions in the following securities on behalf of its clients: ROE, GQQQ, PPI, MSFT, NVDA, AAPL, GE, IBM, CSCO, T, XOM, WMT, and There are no warranties implied. Astoria Portfolio Advisors LLC is a registered investment adviser located in New York. Astoria Portfolio Advisors LLC may only transact business in those states in which it is registered or qualifies for an exemption or exclusion from registration requirements.
- Astoria Portfolio Advisors LLC’s web site is limited to the dissemination of general information pertaining to its advisory services, together with access to additional investment-related information, publications, and Accordingly, the publication of Astoria Portfolio Advisors LLC’s web site on the Internet should not be construed by any consumer and/or prospective client as Astoria Portfolio Advisors LLC’s solicitation to effect, or attempt to effect transactions in securities, or the rendering of personalized investment advice for compensation, over the Internet.
- Any subsequent, direct communication by Astoria Portfolio Advisors LLC with a prospective client shall be conducted by a representative that is either registered or qualifies for an exemption or exclusion from registration in the state where the prospective client resides.
- For information pertaining to the registration status of Astoria Portfolio Advisors LLC, please contact the state securities regulators for those states in which Astoria Portfolio Advisors LLC maintains a registration A copy of Astoria Portfolio Advisors LLC’s current written disclosure statement discussing Astoria Portfolio Advisors LLC’s business operations, services, and fees is available at the SEC’s investment adviser public information website – www.adviserinfo.sec.gov or from Astoria Portfolio Advisors LLC upon written request. Astoria Portfolio Advisors LLC does not make any representations or warranties as to the accuracy, timeliness, suitability, completeness, or relevance of any information prepared by any unaffiliated third party, whether linked to Astoria Portfolio Advisors LLC’s web site or incorporated herein and takes no responsibility therefor. All such information is provided solely for convenience purposes only and all users thereof should be guided accordingly.
- Astoria’s website and the information presented in this report is for educational purposes only and does not intend to make an offer or solicitation for the sale or purchase of any specific securities, investments, or investment Investments involve risk and unless otherwise stated, are not guaranteed. Be sure to first consult with a qualified financial adviser and/or tax professional before implementing any strategy. Our website and the information on our site are not intended to provide investment, tax, or legal advice.
- Past performance is not indicative of future Indices are typically not available for direct investment, are unmanaged, and do not incur fees or expenses.
- This information contained herein has been prepared by Astoria Portfolio Advisors LLC on the basis of publicly available information, internally developed data and other third-party sources believed to be reliable. Astoria Portfolio Advisors LLC has not sought to independently verify information obtained from public and third-party sources and makes no representations or warranties as to accuracy, completeness or reliability of such information.
- All opinions and views constitute judgments as of the date of writing without regard to the date on which the reader may receive or access the information and are subject to change at any time without notice and with no obligation to update.
- This material is for informational and illustrative purposes only and is intended solely for the information of those to whom it is distributed by Astoria Portfolio Advisors No part of this material may be reproduced or retransmitted in any manner without the prior written permission of Astoria Portfolio Advisors LLC.
- Investing entails risks, including possible loss or some or all of the investor’s The investment views and market opinions/analyses expressed herein may not reflect those of Astoria Portfolio Advisors LLC as a whole and different views may be expressed based on different investment styles, objectives, views or philosophies. To the extent that these materials contain statements about the future, such statements are forward looking and subject to a number of risks and uncertainties.
- Any third-party websites provided on astoriaadvisors.com or in this report are strictly for informational purposes and for convenience. These third-party websites are publicly available and do not belong to Astoria Portfolio Advisors LLC. We do not administer the content or control it. We can not be held liable for the accuracy, time sensitive nature, or viability of any information shown on these sites. The material in these links are not intended to be relied upon as a forecast or investment advice by Astoria Portfolio Advisors LLC, and does not constitute a recommendation, offer, or solicitation for any security or any investment strategy. The appearance of such third-party material on our website does not imply our endorsement of the third- party website. We are not responsible for your use of the linked site or its content. Once you leave Astoria Portfolio Advisors LLC’s website, you will be subject to the terms of use and privacy policies of the third-party website.
- Please note that Astoria Portfolio Advisors serves as a sub-advisor to the Astoria US Quality Growth Kings ETF (GQQQ), the Astoria US Equal Weight Quality Kings ETF (ROE), and the AXS Astoria Real Assets ETF (PPI). Effective October 15, 2024, the Fund (PPI) name changed its name from AXS Astoria Inflation Sensitive ETF to the AXS Astoria Real Assets ETF and transferred its stock exchange listing to Nasdaq from the New York Stock Exchange. Please consult your financial advisor and review the prospectus to evaluate your suitability and investment risk tolerance before purchasing the GQQQ, ROE, or PPI The information contained does not imply a recommendation for GQQQ, ROE, or PPI The Funds (GQQQ and ROE) are distributed by Quasar Distributors, LLC. The Funds’ investment advisor is Empowered Funds, LLC, which is doing business as ETF Architect. The Fund (PPI) is distributed by ALPS Distributors, Inc, which is not affiliated with AXS Investments. For more information on each of the ETFs, please click their respective links: GQQQ, ROE, PPI.
- This material must be preceded or accompanied by a Please read the prospectus carefully before investing. The Fund’s investment objectives, risks, charges and expenses must be considered carefully before investing. Click here for the GQQQ Prospectus and SAI. Click here for the ROE Prospectus and SAI. All fund documents for GQQQ and ROE can be found at astoriaadvisorsetfs.com/roe and astoriaadvisorsetfs.com/gqqq. Click here for the PPI Prospectus and SAI. All fund documents for PPI can be found at axsinvestments.com/ppi/#funddetails.
- Investments involve Principal loss is possible. Redemptions are limited and often commissions are charged on each trade. Unlike mutual funds, ETFs may trade at a premium or discount to their net asset value.
- An investment in the Fund involves risk, including those described There is no assurance that the Fund will achieve its investment objective. An investor may lose money by investing in the Fund. An investment in the Fund is not a bank deposit and is not insured or guaranteed by the FDIC or any government agency.
- Quality Stocks Risk. Stocks included in the Fund are deemed by the Sub-Adviser to be quality stocks, but there is no guarantee that the past performance of these stocks will Companies that issue these stocks may experience lower than expected returns or may experience negative growth, as well as increased leverage, resulting in lower than expected or negative returns to Fund shareholders. Many factors can affect a stock’s quality and performance, and the impact of these factors on a stock or its price can be difficult to predict.
- Management The Fund is actively-managed and may not meet its investment objective based on the Adviser’s or Sub-Adviser’s success or failure to implement investment strategies for the Fund. The success of the Fund’s investment program depends largely on the investment techniques and risk analyses applied by the Sub-Adviser, including the use of quantitative models or methods. It is possible the investment techniques and risk analyses employed on behalf of the Fund will not produce the desired results.
- Value-Style Investing The Sub-Adviser may be wrong in its assessment of a company’s value, and the stocks the Fund owns may not reach what the Sub-Adviser believes are their true values. The market may not favor value-oriented stocks and may not favor equities at all, which may cause the Fund’s relative performance to suffer. Value stocks can perform differently from the market as a whole and from other types of stocks. While certain value stocks may increase in value more quickly during periods of anticipated economic upturn, they may also lose value more quickly in periods of anticipated economic downturn. Furthermore, there is the risk that the factors which caused the depressed valuations are longer term or even permanent in nature, and that their valuations may fall or never rise.
- Dividend-Paying Common Stock The Fund will normally receive income from dividends that are paid by issuers of the Fund’s investments. The amount of the dividend payments may vary and depends on performance and decisions of the issuer. Poor performance by the issuer or other factors may cause the issuer to lower or eliminate dividend payments to investors, including the Fund. Additionally, these types of securities may fall out of favor with investors and underperform the broader market.
- Quantitative Security Selection Data for some companies may be less available and/or less current than data for companies in other markets. The Sub-Adviser uses quantitative analysis, and its processes could be adversely affected if erroneous or outdated data is utilized. The securities selected using quantitative analysis could perform differently from the financial markets as a whole as a result of the characteristics used in the analysis, the weight placed on each characteristic and changes in the characteristic’s historical trends. In addition, the investment analysis used in making investment decisions may not adequately consider certain factors, or may contain design flaws or faulty assumptions, any of which may result in a decline in the value of an investment in the Fund.
- New Fund The Fund is new with no operating history as of the date of this Prospectus. As a result, prospective investors have no track record or history on which to base their investment decision. There can be no assurance that the Fund will grow to or maintain an economically viable size.
- Cash and Cash Equivalents Holding cash or cash equivalents rather than securities or other instruments in which the Fund primarily invests, even strategically, may cause the Fund to risk losing opportunities to participate in market appreciation, and may cause the Fund to experience potentially lower returns than the Fund’s benchmark or other funds that remain fully invested. In rising markets, holding cash or cash equivalents will negatively affect the Fund’s performance relative to its benchmark.
- Premium-Discount The Shares may trade above or below their NAV. The NAV of the Fund will generally fluctuate with changes in the market value of the Fund’s holdings. The market prices of Shares, however, will generally fluctuate in accordance with changes in NAV as well as the relative supply of, and demand for, Shares on the Exchange and other securities exchanges. The existence of significant market volatility, disruptions to creations and redemptions, or potential lack of an active trading market for Fund Shares (including through a trading halt), among other factors, may result in the Shares trading significantly above (at a premium) or below (at a discount) to NAV. If you buy Fund Shares when their market price is at a premium or sell the Fund Shares when their market price is at a discount, you may pay more than, or receive less than, NAV, respectively. The Adviser cannot predict whether Shares will trade below, at or above their NAV. Price differences may be due, in large part, to the fact that supply and demand forces at work in the secondary trading market for Shares will be closely related to, but not identical to, the same forces influencing the prices of the securities held by the Fund. However, given that Shares can be purchased and redeemed in large blocks of Shares, called Creation Units (unlike shares of closed-end funds, which frequently trade at appreciable discounts from, and sometimes at premiums to, their NAV), and the Fund’s portfolio holdings are fully disclosed on a daily basis, the Adviser believes that large discounts or premiums to the NAV of Shares should not be sustained, but that may not be the case.
- Growth Investing The Fund invests in growth securities, which may be more volatile than other types of investments, may perform differently than the market as a whole and may underperform when compared to securities with different investment parameters. Under certain market conditions, growth securities have performed better during the later stages of economic recovery (although there is no guarantee that they will continue to do so).
- There is no guarantee the sectors or asset classes the advisor identifies will benefit from inflation Fund may invest a larger portion of its assets in one or more sectors than many other funds, and thus will be more susceptible to negative events affecting those sectors.
- Real Assets Risk: The Fund’s investments in securities linked to real assets, such as precious metals, commodities, land, equipment and natural resources, involve significant risks, including financial, operating, and competitive Investments in securities linked to real assets may expose the Fund to adverse macroeconomic conditions, such as changes and volatility in commodity prices, a rise in interest rates or a downturn in the economy in which the asset is located. Changes in inflation rates or in the market’s inflation expectations may adversely affect the market value of equities linked to real assets.
- Market Risk: The market price of a security or instrument may decline, sometimes rapidly or unpredictably, due to general market conditions that are not specifically related to a particular company, such as real or perceived adverse economic, political, or geopolitical conditions throughout the world, changes in the general outlook for corporate earnings, changes in interest or currency rates, or adverse investor sentiment generally.
- Equity Risk: The value of the equity securities held by the Fund may fall due to general market and economic conditions, perceptions regarding the industries in which the issuers of securities held by the Fund participate, or factors relating to specific companies in which the Fund invests.
- Commodities Risk: The Fund has exposure to commodities through investments in Underlying Commodity prices can have significant volatility, and exposure to commodities can cause the value of the Fund’s shares to decline or fluctuate in a rapid and unpredictable manner.
- Futures Contracts Risk: The Fund expects that certain of the underlying ETFs in which it invests will utilize futures contracts for its commodities The risk of a position in a futures contract may be very large compared to the relatively low level of margin the Underlying ETF is required to deposit in many cases a relatively small price movement in a futures contract may result in immediate and substantial loss or gain to the investor relative to the size of a required margin deposit. The prices of futures contracts may not correlate perfectly with movements in the securities or index underlying them.
- Shares of ETFs are bought and sold at market price (not NAV) and are not individually redeemed from the ETF Brokerage commissions will reduce returns NAV are calculated using prices as of 400 FM Eastern Time The closing price is the midpoint between the bid and ask price as of the close of Closing price returns do not represent the returns you would receive if you traded shares at other times.
