
In prior market commentary and updates, we have highlighted the normal election year trends and our expectations for volatility around the election cycle. We are now less than 45 days from the presidential election, and it seems like the political tension has elevated to historic levels.
This year certainly has not been the typical election year as the normal election rhetoric was largely absent due to the pandemic, the economic collapse and rebound, and figuring out what a sense of normalcy looks like in a pandemic world. As we move closer to November, it appears that we will have anything but a normal election. The sad and untimely passing of Justice Ginsberg has elevated what was already bound to be a very contentious election.
Taking a Look Back in Time
Let’s look at history first and then dive into the upcoming election. Historically, the market tends to do better in an election year when an incumbent Republican wins and conversely, does the poorest when an incumbent Republican loses.
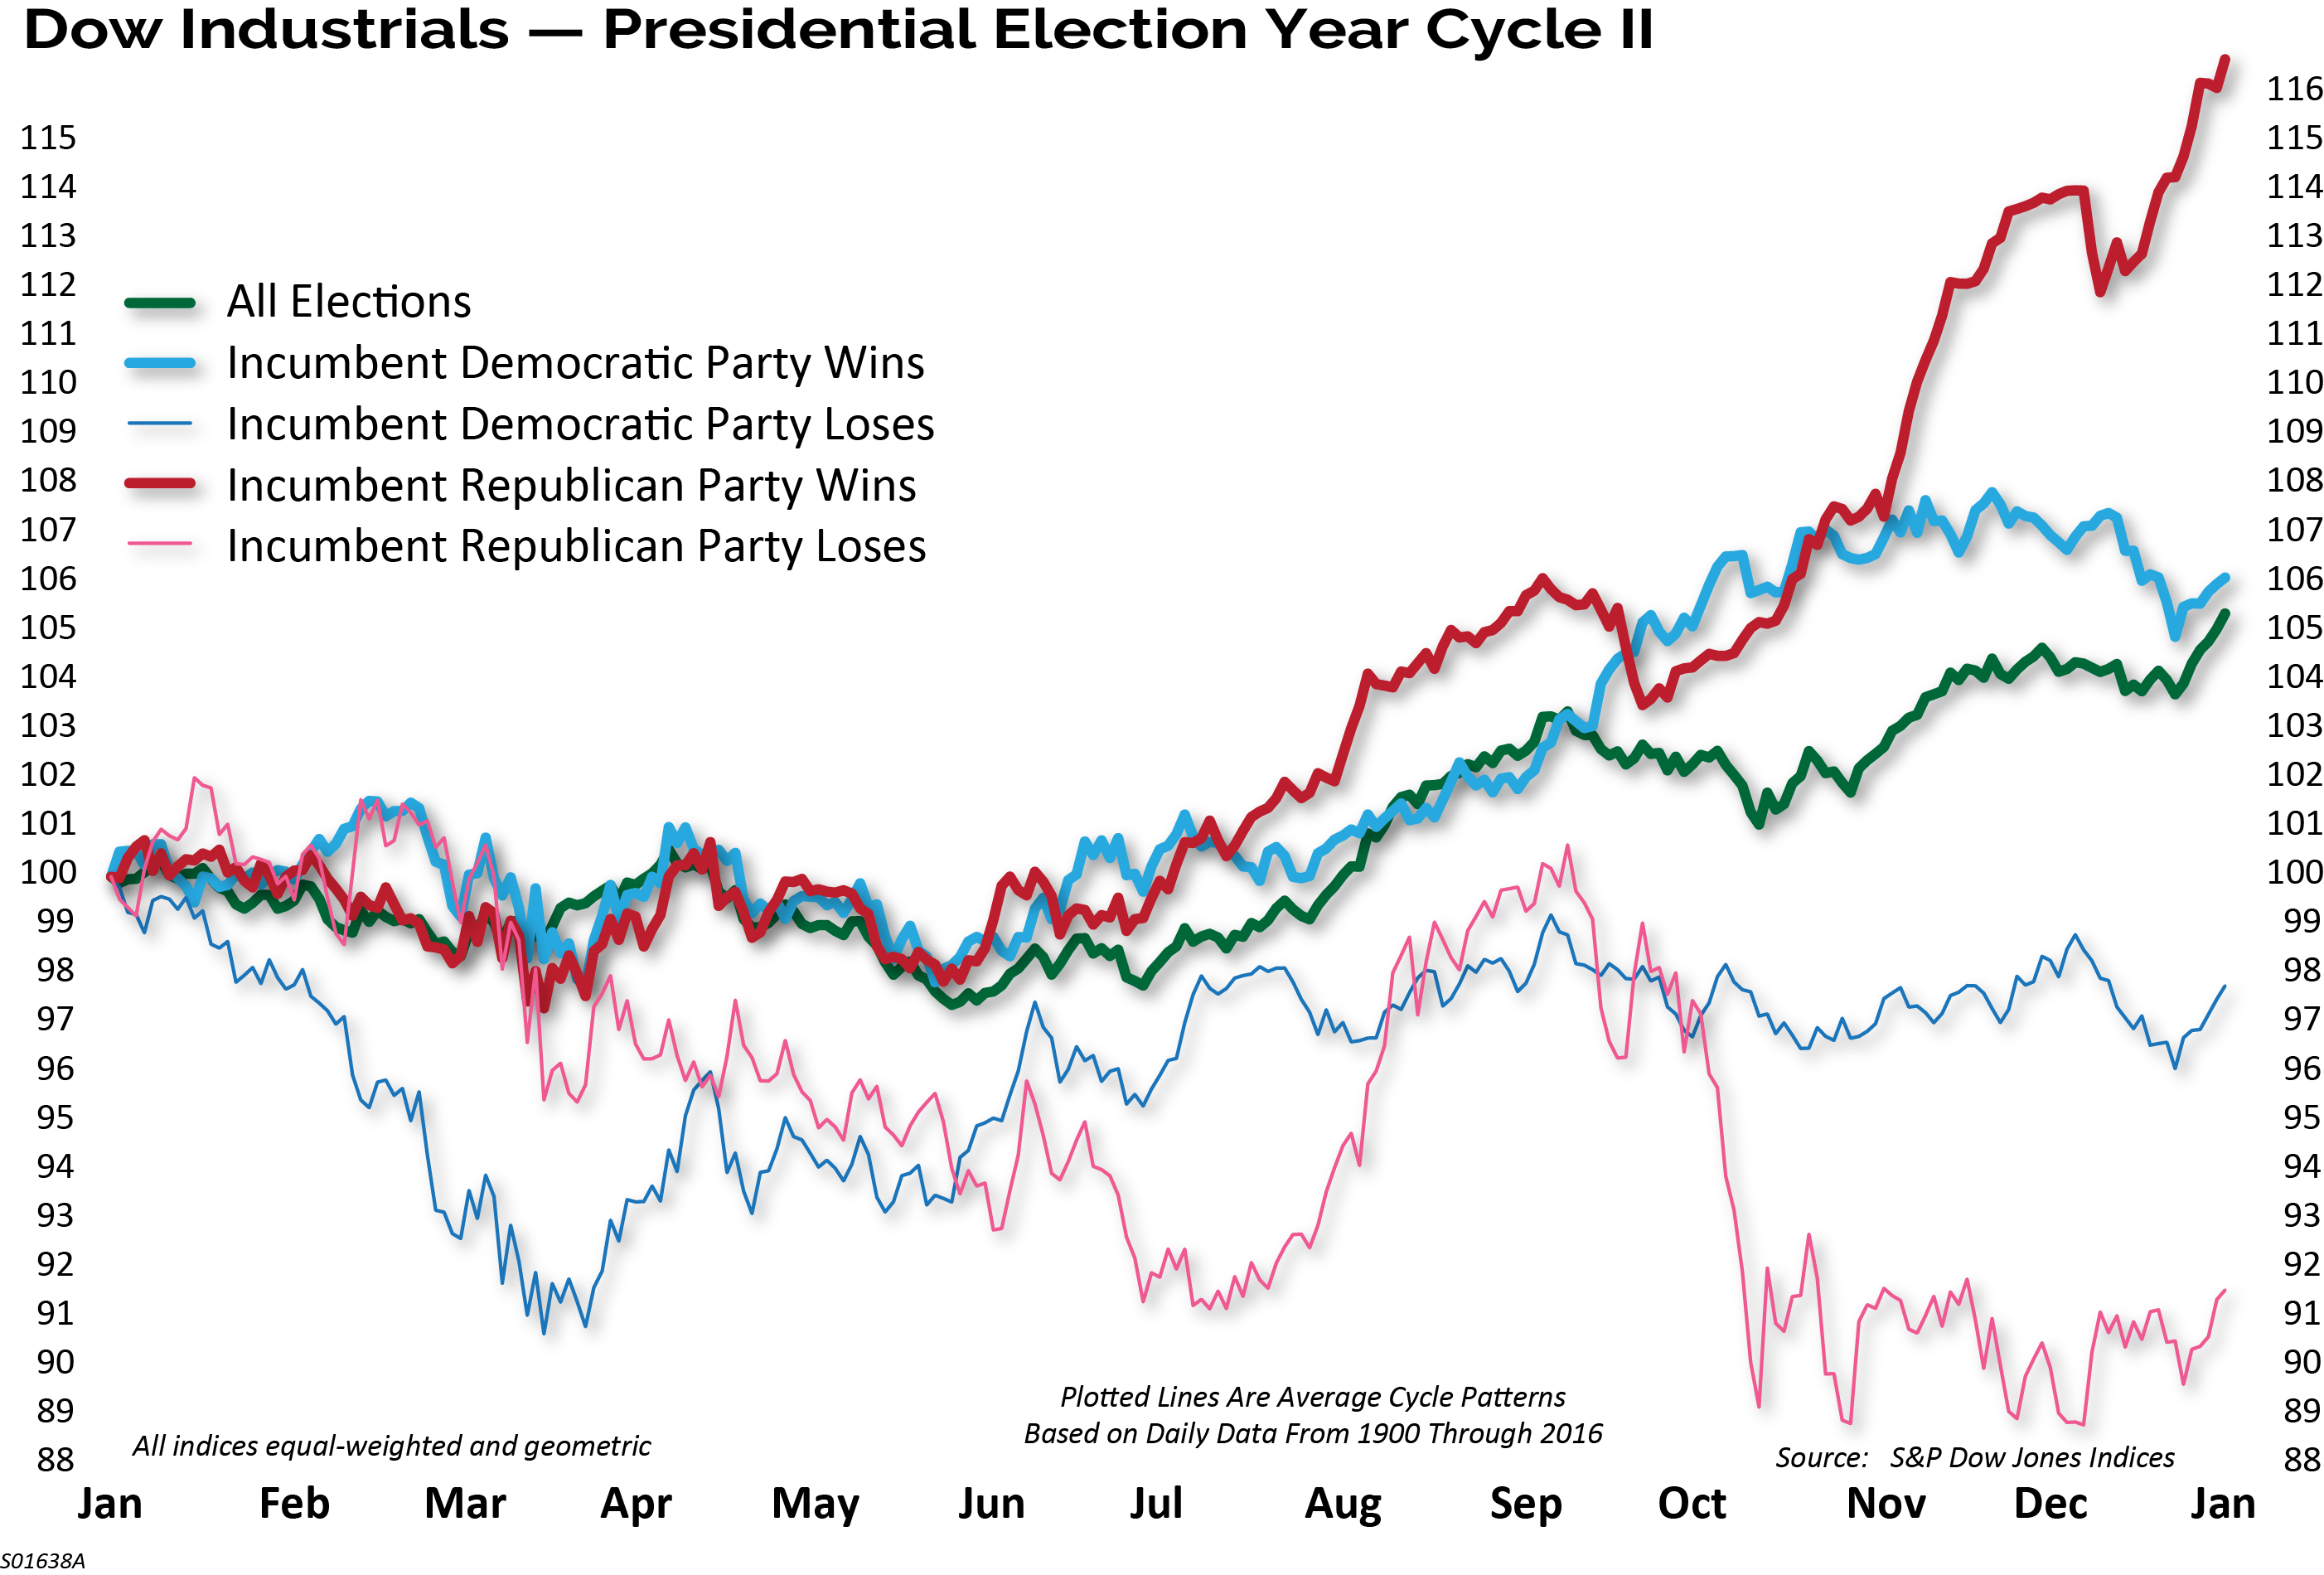
It’s very rare for the incumbent party to win re-election in years when there is a recession or a 20% drop in the market during the election year. How rare? Since 1952, the incumbent party is 0 for 6. On the flip side, the incumbent party is 8 for 11 in years without a recession or steep market decline. 2020 had both a recession and a greater than 20% correction.
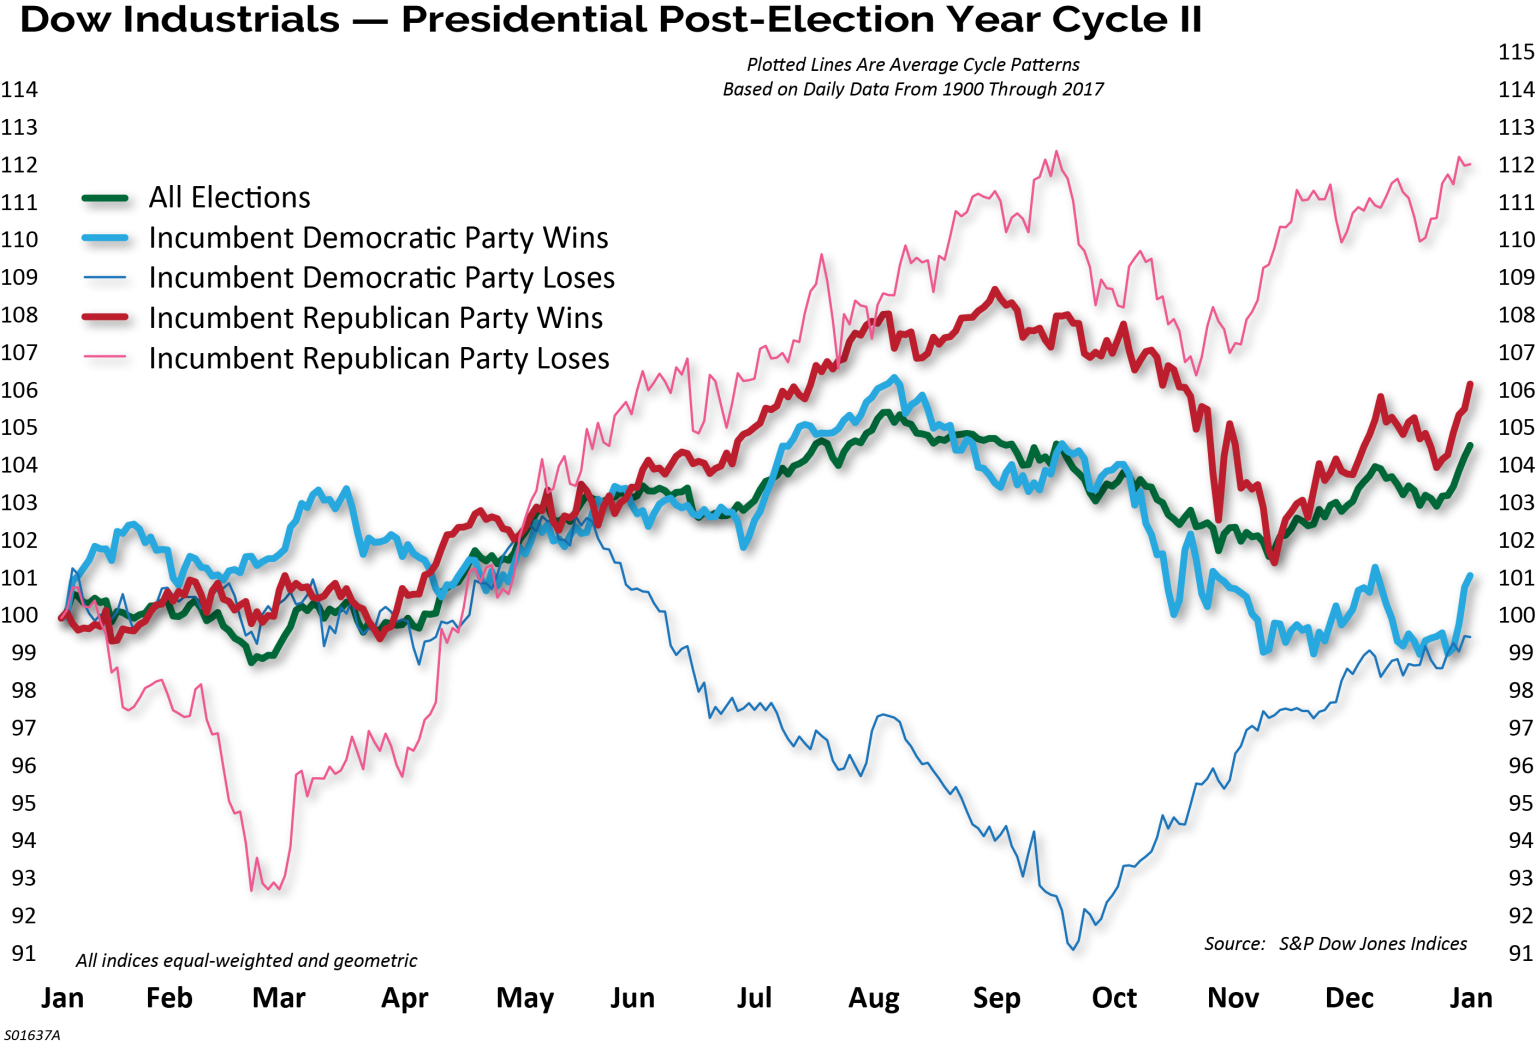
Ironically, the market tends to do the best in the year after the election when a Republican incumbent loses. That makes sense given that investor psychology plays a large role in the intermediate-term direction of the markets. Investors tend to get overly optimistic and pessimistic about the election. Fears surrounding both parties tend to be overblown, setting the stage for a reversion of trends.
Market Performance Leading Up to Election Day
InvesTech Research did a study on the market’s performance just before the election. The stock market typically reflects the economic outlook in the weeks leading up to Election Day. A rising market indicates an improving economy, which means rising confidence and an increased chance for the incumbent party to retain the top office. In other words, people tend to vote with their pocketbooks.
Historically, the market’s performance in the three months leading up to a presidential election has predicted the winner with an 87% success rate. Since 1928, there have been 23 presidential elections, and in 14 of them, the S&P 500 gained during the three months preceding Election Day. In 12 of those 14 instances, the incumbent president or party won the presidency. Conversely, when the S&P 500 fell over that three-month period, the incumbent party lost. There have been only three exceptions to this phenomenon and those were in 1956, 1968, and 1980.
Election Day is November 3rd this year. The countdown from the three-month mark before the election began on August 3rd. So far, the S&P 500 is marginally positive. We will be watching to see how the market performs as we approach the election.
Accuracy: 20 out of 23 (87.0%)
| Election Year | S&P 500 3 Month Gain/Loss | Incumbent Party | Stock Market Accuracy |
|---|---|---|---|
| 1928 | 13.6 | Won | Yes |
| 1932 | -2.6 | Lost | Yes |
| 1936 | 7.9 | Won | Yes |
| 1940 | 8.6 | Won | Yes |
| 1944 | 2.3 | Won | Yes |
| 1948 | 5.4 | Won | Yes |
| 1952 | -3.3 | Lost | Yes |
| 1956 | -2.6 | Won | No |
| 1960 | -0.7 | Lost | Yes |
| 1964 | 2.6 | Won | Yes |
| 1968 | 6.5 | Lost | No |
| 1972 | 3.0 | Won | Yes |
| 1976 | -0.1 | Lost | Yes |
| 1980 | 6.7 | Lost | No |
| 1984 | 4.8 | Won | Yes |
| 1988 | 1.9 | Won | Yes |
| 1992 | -1.2 | Lost | Yes |
| 1996 | 8.2 | Won | Yes |
| 2000 | -3.2 | Lost | Yes |
| 2004 | 2.2 | Won | Yes |
| 2008 | -19.5 | Lost | Yes |
| 2012 | 2.5 | Won | Yes |
| 2016 | -1.9 | Lost | Yes |
A Democratic Sweep?
It’s not just the top of the ticket that is in play, but the shape of Congress is up for grabs too. Current consensus is that the Democrats will retain control of the House, and could potentially gain control of the Senate. Republicans currently hold a 53-47 seat advantage in the Senate. Democrats need a net gain of three seats if they win the presidency to gain control of the Senate, because the Vice President serves as the tiebreaker in 50-50 scenarios. If Trump wins the presidency, then Democrats would need a net gain of four seats to have a 51-49 seat advantage. This is important as the political party in control of the Senate can set the agenda in terms of hearings and legislation to be considered.
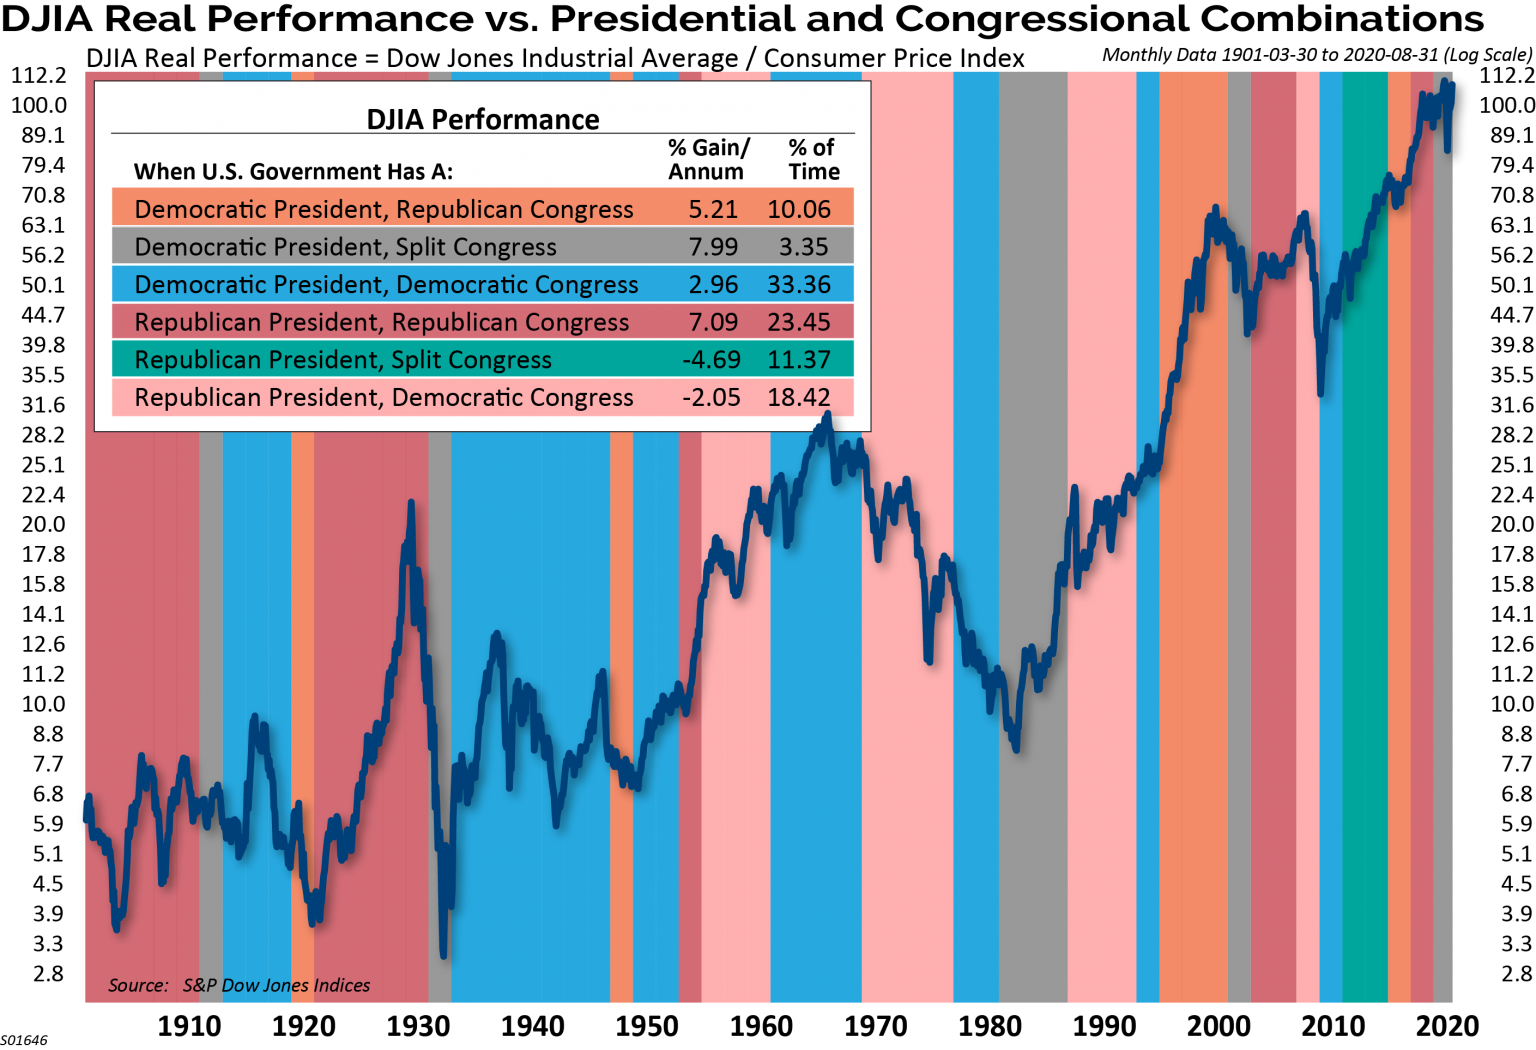
According to FiveThirtyEight election forecast models, Joe Biden has a 77% chance of winning the election. A growing consensus is for a Democratic sweep. We believe it’s interesting to see just how the market has performed over time given different makeups of the White House residency and Congress. It is generally considered that the market likes gridlock, where the status quo is likely to remain without any major legislation.
However, the chart below illustrates that this is not always the case. For example, in real terms the market has done poorly under Republican presidents with split or Democratic control of Congress. Conversely, the market has done well under Democratic presidents when Congress has the ability to check presidential power. A clean sweep by the Democrats, which is the growing consensus for the upcoming election, has historically yielded low single-digit real returns.
Election Day Delay
Mail-in voting is a hot topic this election cycle. Many people are afraid of the health risks of voting in person at the polls and therefore, mail-in voting is expected to surge. There is also a huge possibility that the winner will not be declared on election night, or even shortly after, due to the massive amounts of mail-in ballots that will need to be counted.
A few key battleground states including Pennsylvania, Michigan, and Wisconsin, do not allow mail-in ballots to be counted until Election Day. That alone could result in a delay of declaring a winner. There is a lot of chatter about the possibility of Trump being ahead on Election Day, only to see that lead narrow or disappear as mail-in votes are counted.
If either candidate has a commanding lead on election night, it is possible that the other concedes. However, if the outcome is too close to call, then it is likely that both Trump and Biden would exhaust their legal options, which could take additional weeks depending on the number of states in question.
Election Timeline
| Nov. 3 | Election Day |
| Nov. 5- Dec. 12 | Dates vary for states to certify the results |
| Dec. 14 | Electors cast their ballots. The candidate with 270 or more wins |
| Jan. 6 | Joint session of Congress convenes and Vice President Pence presiding to certify the results |
| Jan. 20 | President and Vice President are sworn into office |
The last contested election occurred in 2000 between George W. Bush and Al Gore, which ran on until December 13th, when Gore conceded and Bush accepted the presidency. The 2000 election only featured a contested result in one state (Florida), while 2020 has the potential to feature contested results in several states. It is uncertain exactly how the markets would react to such a scenario, given that possible outcome. We know that markets do not like uncertainty, and regardless of who is declared the winner, supporters of the opposition may view the president as illegitimate.
Taxes, Trade and Regulation
The main differences between a Trump or Biden presidency on the policy front centers around taxes, fiscal policy, regulation, and China. Under Trump, the corporate tax rate dropped from 35% to 21%. If re-elected, federal tax policy will remain unchanged, and the tough stance on China and tariffs will be maintained.
Biden’s plan calls for raising the corporate tax rate from 21% to 28% and raising individual rates on those who make more than $400K. The hike in corporate taxes would have an impact of reducing corporate earnings per share by between 4%-13%. The plan has been widely telegraphed, so it’s possible that some of the potential tax hike is already priced into the market. The prospect of larger fiscal stimulus and more predictability in trade policy that would come from a Biden victory would likely be viewed positively by the markets and could support the outperformance of economic cyclicals over defensive sectors.
Putting It Into Perspective
Electing a president is an American ritual that we do every four years. I remember the leadup to the 2016 election and the sense of real fear from many people that if their candidate didn’t win, the market was going to collapse. But here we are four years later, still standing. I believe that no matter the outcome, or how long it takes, we will get through this election too.
The next several weeks will be a challenging time for investor psychology. Our hope is that by offering some historical context, investors will be able to put any election-related volatility into perspective. As always, we believe that the best way for clients to achieve financial success is to remain focused on their long-term goals and not short-term volatility.
If you would like to discuss your clients’ investment or tax considerations, contact a Clark Capital Investment Consultant: 800.766.2264
The opinions referenced are as of the date of publication and are subject to change due to changes in the market or economic conditions and may not necessarily come to pass. There is no guarantee of the future performance of any Clark Capital investments portfolio. Material presented has been derived from sources considered to be reliable, but the accuracy and completeness cannot be guaranteed. Nothing herein should be construed as a solicitation, recommendation or an offer to buy, sell or hold any securities, other investments or to adopt any investment strategy or strategies. For educational use only. This information is not intended to serve as investment advice. This material is not intended to be relied upon as a forecast or research.
The S&P 500 Index is a stock market index that measures the stock performance of 500 large companies listed on stock exchanges in the United States. An obligor rated ‘BBB’ has adequate capacity to meet its financial commitments. However, adverse economic conditions or changing circumstances are more likely to lead to a weakened capacity of the obligor to meet its financial commitments.
This document may contain certain information that constitutes forward-looking statements which can be identified by the use of forward-looking terminology such as “may,” “expect,” “will,” “hope,” “forecast,” “intend,” “target,” “believe,” and/or comparable terminology (or the negative thereof). Forward looking statements cannot be guaranteed. No assurance, representation, or warranty is made by any person that any of Clark Capital’s assumptions, expectations, objectives, and/or goals will be achieved. Nothing contained in this document may be relied upon as a guarantee, promise, assurance, or representation as to the future.
Clark Capital Management Group, Inc. is an investment adviser registered with the U.S. Securities and Exchange Commission. Registration does not imply a certain level of skill or training. More information about Clark Capital’s advisory services and fees can be found in its Form ADV which is available upon request.
CCM-500
