
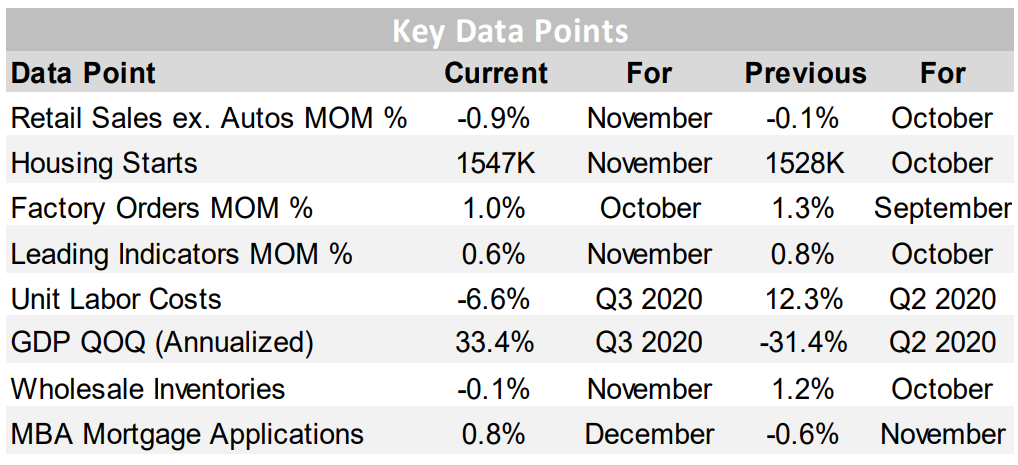
The U.S. economy slowed into year-end as coronavirus cases surged following holiday gatherings and newly initiated shut-downs were enacted by various state governments. The slowdown will likely be reflected more clearly in the December and January numbers, as early Fall had the US economy on the rebound.
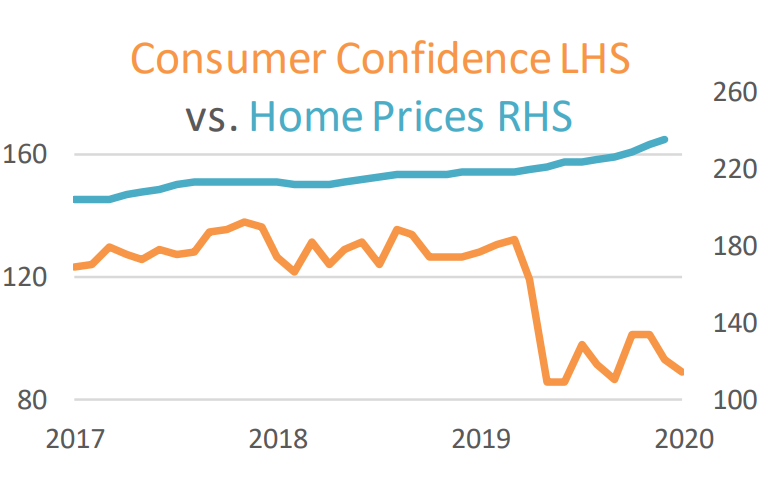
Housing continues to be a positive for the economy as builders cope with a structural shortage of housing stock. Despite a slight drop in November’s MoM New Home Sales and Existing Home Sales (-11.0% and -2.5% respectively), Housing Starts (+1.2% MoM), Building Permits (+6.2% MoM) and Pending Home Sales (+16.0% MoM) all pointed to strength in the sector. Mortgage rates remain at historical lows, although the S&P CoreLogic CS 20-City Home Price Index rose +7.95% YoY through October and the risk of pricing first-time home buyers out of the market is growing.
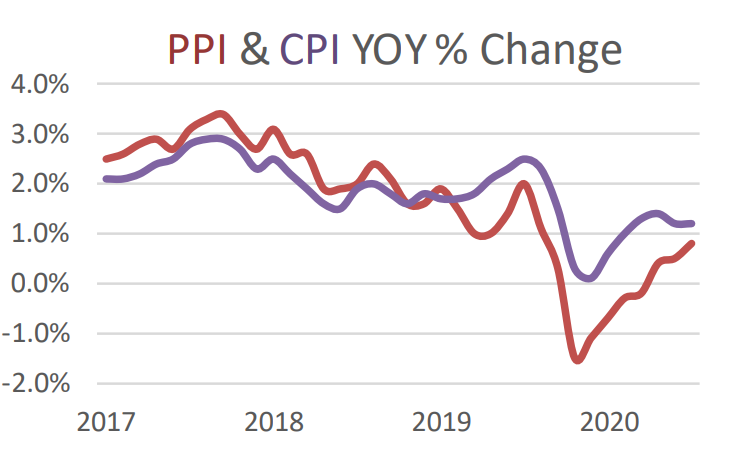
Despite the surge in home prices, broad inflation remains tame. The Consumer Price Index gained just +0.2% in November (+1.2% YoY), while Core CPI also rose +0.2% MoM (+1.6% YoY). Producer Prices edged up +0.1% MoM in November and finished up just +0.8% YoY. Export Prices fell -1.1% YoY and the PCE Deflator was flat for the month, inching up +1.1% YoY.
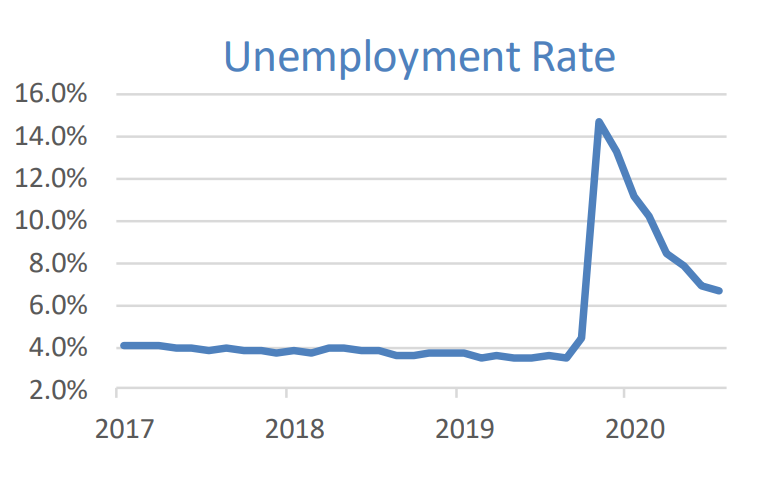
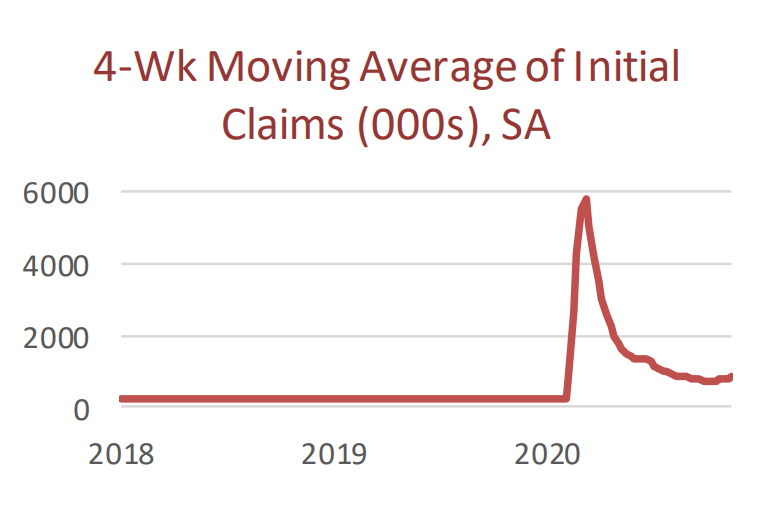
The Unemployment Rate for November came in as expected at 6.7%, down from the prior month’s 6.9% read, as payrolls grew by a lower-than-expected 245k. A year ago unemployment had reached a low of 3.5% before soaring to 13.03% at the height of the Spring pandemic onset. Initial Jobless Claims for December edged lower on the month, although still averaged north of 800k.
With the Federal Reserve seemingly on hold for all of 2021 and the rollout of the Covid-19 vaccine gaining steam, it would appear the green light is flashing for investors. While we anticipate a difficult Q1 and Q2, the back half of 2021 should see solid economic growth assuming an end to lock downs and the broad acceptance of the vaccination policy.
Domestic Equity
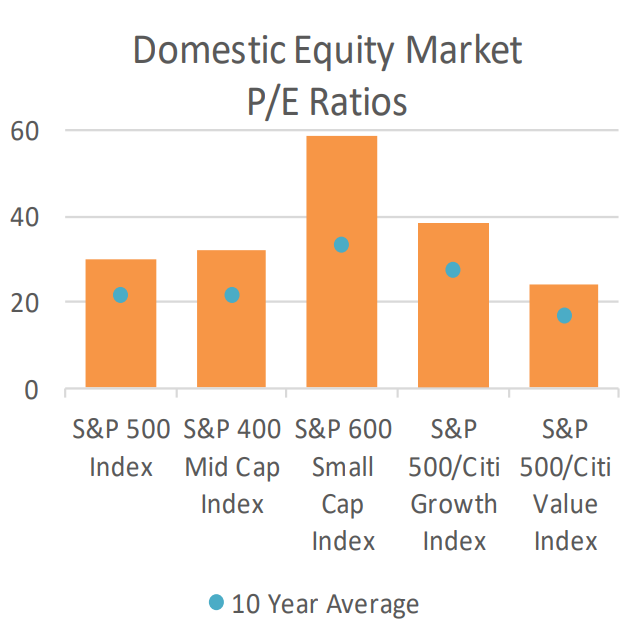
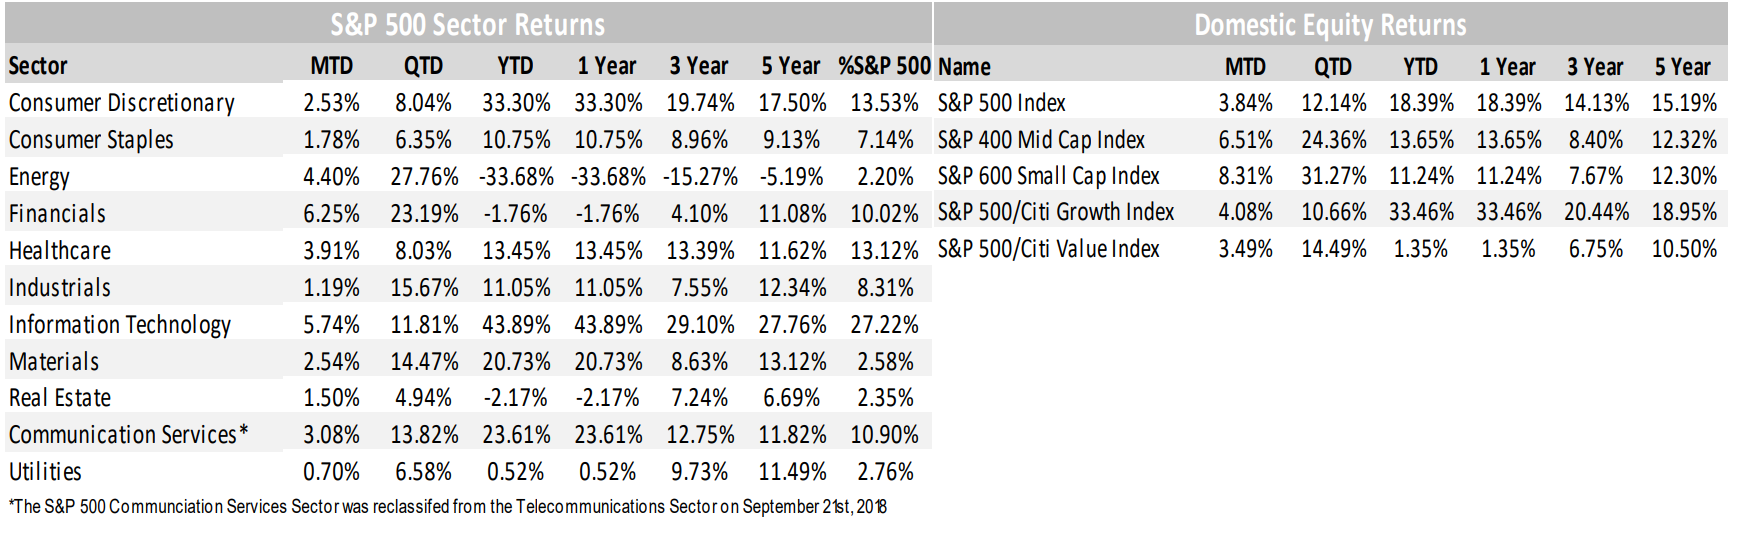
U.S. equities finished the month of December on a high note with the benchmark S&P 500 Index closing at a new record high of 3,756. The large-cap index rose +3.84% on the month, capping a quarter in which it gained an eye popping +12.15%, and a tumultuous year (to say the least) up +18.40%. Despite all of the adversity globally, a liquidity boost from the Federal Reserve helped propel listed equities of all sizes. Mid- and Small-caps, as measured by the S&P 400 and S&P 600 Indices also had notable gains, rising +6.52% and +8.32% respectively on the month. For the quarter, the same Mid- and Small-Cap equity benchmarks soared +24.37% and +31.31%, respectively, to end the year up +13.66% and +11.29% apiece.
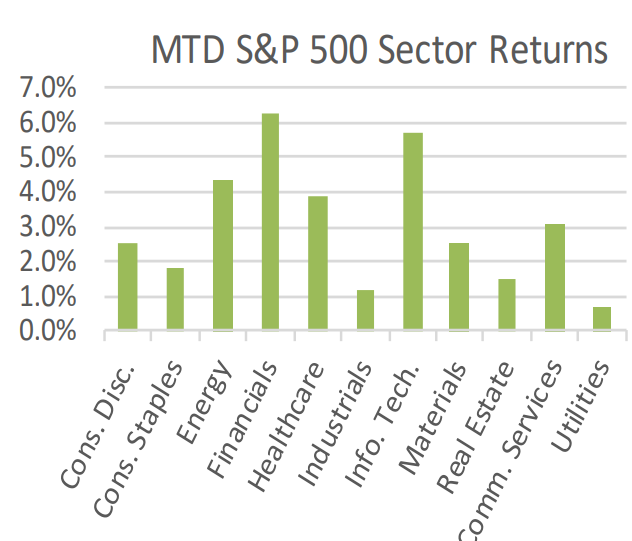
From a sector standpoint, all 11 GICS sectors finished the month of December in the black, led by Financials and Information Technology which rose +6.25% and +5.74% respectively on the month. Banks received the go ahead from the Fed to begin stock repurchases again, albeit on a limited basis. JP Morgan for instance announced a $30 Billion repurchase plan. With many banks such as Citi and Wells Fargo trading near or below tangible book value, buying back stock is arguably the most immediate and shareholder friendly way to boost earnings. Couple return of capital with a steepening yield curve and ultra-reasonable Bank valuations, and Financials have a long runway to return to their pre-crisis highs. Apple, on the other hand, made a new record high on reports of “renewed” interest in autonomous vehicles, which helped the stock gain +11.46% on the month to cap off a +80.75% gain on the year. Laggards on the month included defensive sectors such as Utilities, which rose +0.70%; however, Utilities did manage to eke out a +0.48% gain on the year. Energy was the worst performing sector in 2020 with a loss of -33.68%.
2020 will forever go down as the year of acronyms, as COVID-19 pulled forward gains in FAAMG and WFH (work from home) stocks. FAAMG stocks gained an average of +52.40% in 2020, and WFH stocks involved with e commerce soared. Growth stocks, as measured by the S&P 500 Citi Growth Index gained +4.08% on the month, and +33.47% for the year. FAAMG helped power the Technology, Discretionary, and Communications services sectors, which accounted for nearly +16 of the S&P 500’s +18% gain on the year. Value stocks, as measured by the S&P 500 Citi Value Index gained +3.50% in December, and only +1.36% in 2020. The more than +30 percentage point delta between Growth and Value Indices is one of the widest on record and has led many to call for the eventual (or hopeful?) reversion to the mean. While we remain steadfast believers in the mean reversion trade over time, without some combination of rising interest rates, inflation, a pick up in global growth (we could go on) it remains hard to see how the Fed’s easy money policies don’t continue to support high valuations in the short-term. Even Fed Chair Powell suggested as much at his last press conference.
Looking ahead, January should be a month that sees a flurry of action from both a macro and microeconomic perspective, as the Georgia Senate run-offs take place Tuesday 1/5, which will determine control of the Senate and largely dictate President-elect Biden’s first two years (and potentially first term) in Office. Earnings season will begin towards the end of the month, as investor focus likely turns already to 2022 earnings estimates for guidance on continued multiple expansion.
International Equity
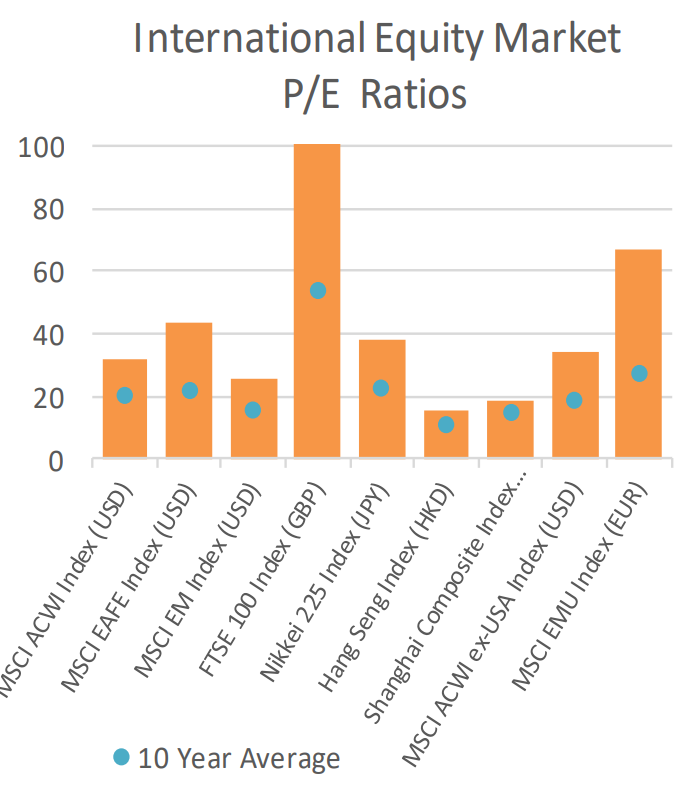
International Equities also finished the month of December on a high note, with Developed Markets (DM) and Emerging Markets (EM) equities soaring. While not finishing at new record highs, they could be in sight for 2021 if global growth picks up and the U.S. Dollar continues to weaken. New highs would be the first since 2007 and perhaps mark a turn in sentiment for the coming year and beyond towards international equities as a whole given they comprise over 40% of the MSCI All-Country World Index (ACWI).
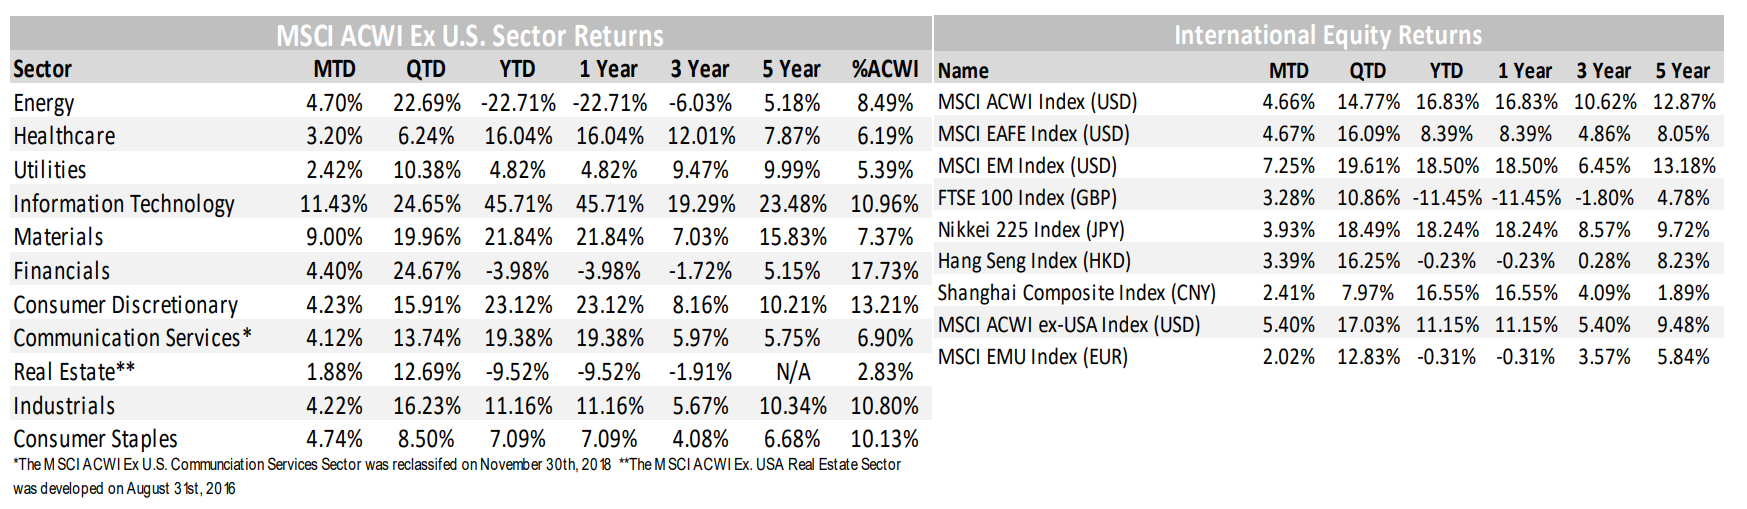
DM equities, as measured by the MSCI EAFE Index gained +4.67% in December, capping off a quarter which saw gains of +16.09%, and a year that returned +8.39% despite COVID-19 related headwinds. EM equities also had a stellar month, gaining +7.25% in December. For the quarter and year, EM equities gained +19.61% and +18.50%, respectively. EM’s strong year came on the back of weakness in the U.S. Dollar, but also from Technology and WFH heavy weights such as Alibaba and Tencent. Despite the recent headlines related to anti-trust concerns in China surrounding Big Tech (and Alibaba specifically), the MSCI China Index still managed to gain +2.77% on the month, and +26.70% on the year. The Empire that Jack Ma built, namely Alibaba and Ant, is under pressure, but that is arguably already reflected in the stock price as Alibaba remains down -19.76% from its all-time high reached back in October. Anti-trust action in China’s Tech sector could be viewed positively long term, as e-commerce, gaming, and mobile payment trends continue to accelerate.
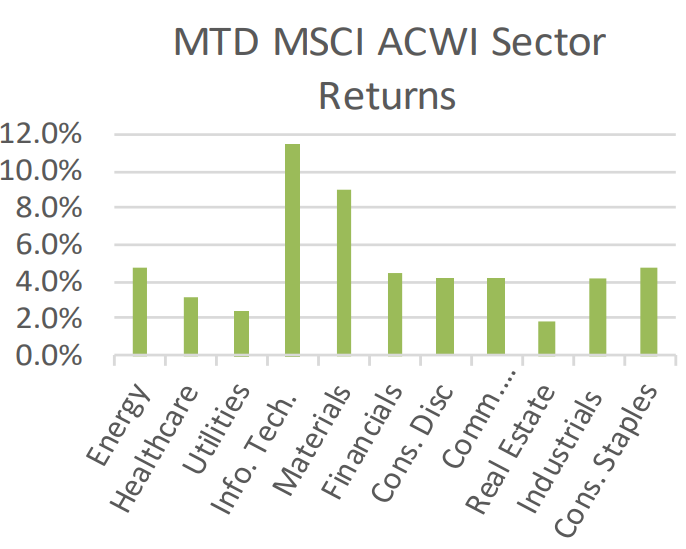
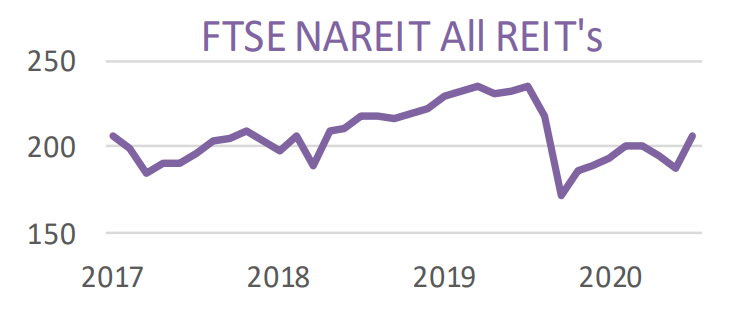
From a sector standpoint, all 11 MSCI ACWI ex-USA sectors finished the month of December in the black, with Technology leading the way up +11.43%. Real Estate was the worst performer, gaining only +1.88%. For the year, Technology, Consumer Discretionary, and Materials were the best performers, gaining +45.71%, +23.12%, and +21.84%, respectively.
Looking ahead to 2021, Value oriented sectors likely stand to benefit as the European Central Bank (ECB) and Bank of England (BoE) have loosened capital return restrictions on Banks, and in the case of the ECB has encouraged Banks to tie up. A continued regulatory push towards climate related goals may propel other Value oriented sectors such as Industrials, Materials, and Energy, but only time will tell. International Equities tend to have a high degree of cyclicality to them, and may benefit from continued progress on the COVID-19 vaccine front.
Lastly, it should be noted that the United Kingdom officially split from the European Union. Nearly 4-years later, “Brexit” has come to a head. While much remains uncertain, and the future is no more certain, it may mean the UK is investable once again, with the Pound trading at $1.36 USD/GBP versus nearly $1.45 pre-Brexitback in 2016. UK asset prices are lower, have lagged their European counterparts by 26.94% cumulatively since July 1, 2016 (as measured by the MSCI EMU Index), and have secured vaccines from three providers so far (7 in total pending final approval), which could amount to over 350 million doses. The UK has approximately 70 Million people, or less than the 100 Million doses just secured from homegrown AstraZeneca. Stay tuned.
Fixed Income
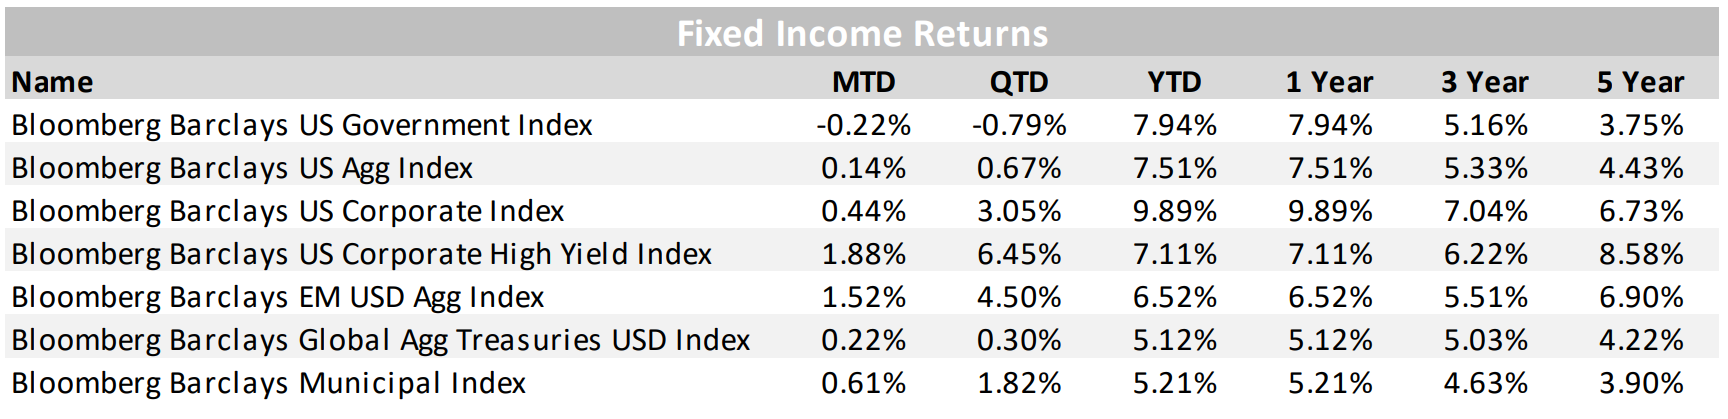
The yield curve moved very little in December, minimizing duration as a component of the monthly returns, even as it remains a major component of year-long 2020 performance.
Government bond exposure was a laggard in the final month of the year, but posted impressive numbers for all of 2020. This strong performance was fueled by the decline in yields across the curve during the pandemic selloff in the first half of 2020. While short-term Treasury maturities offer little value, longer maturities do offer some ballast against a risk-off move in the markets. Typically, the longer the maturity/duration, the better the risk offset received. For a more thoughtful approach, it is possible to focus on the portion of the yield curve that appears to offer the most value. Currently, the 15 to 20 year area looks to provide a nice balance of yield and duration.

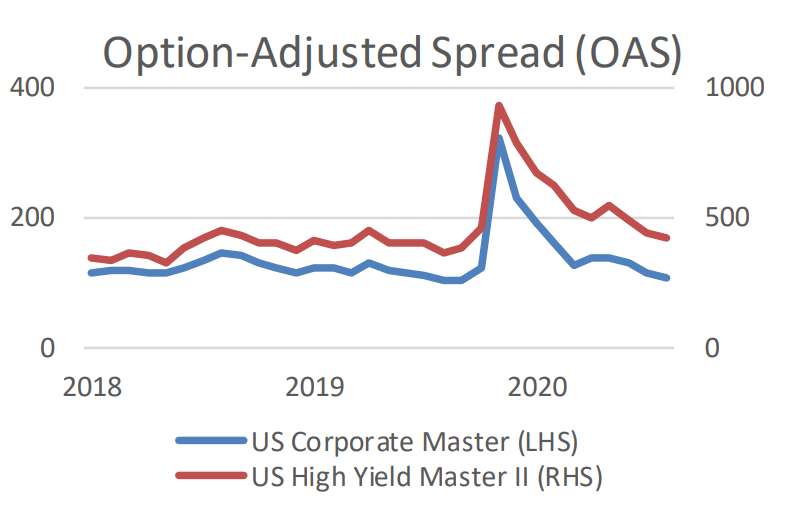
Investment Grade corporate spreads continued to tighten in December. They are now inside of pre-pandemic levels. It is a development to watch closely. Economic uncertainty is higher than a year ago, as are corporate debt levels. Traditionally, you would expect wider spreads in this scenario. The offsetting circumstances are the expectations for the Federal Reserve to support the financial markets and keep interest rates low for an extended period of time. Recent comments by Federal Reserve Chairperson Jerome Powell have reinforced this.
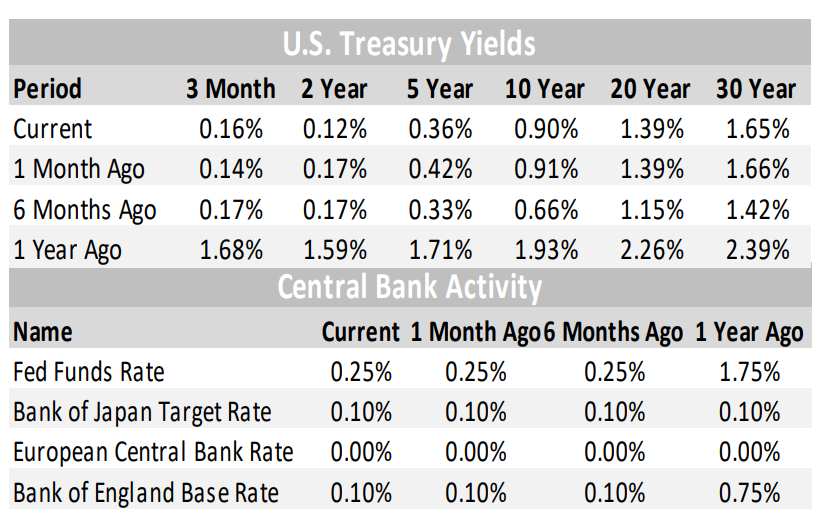
High Yield spreads tightened in December. They are approaching the extremely tight levels that we saw in early 2020, prior to pandemic fears pushing spreads wider. High Yield spreads have seen tighter levels historically and appear to offer slightly more value than Investment Grade, even with the current uncertainty.
Emerging Market bonds also had a good month, following the risk-on playbook of December.
Municipal bonds did well in the final month of the year, and capped off a strong 2020. This is even more impressive when considering the more than 10% increase in issuance, fueled by refunding current outstanding bonds, utilizing taxable issuance.
Alternative Investments
Alternative Investments were mostly positive in December, finishing a strong year in which global equities and most other asset classes rose broadly despite the volatility.
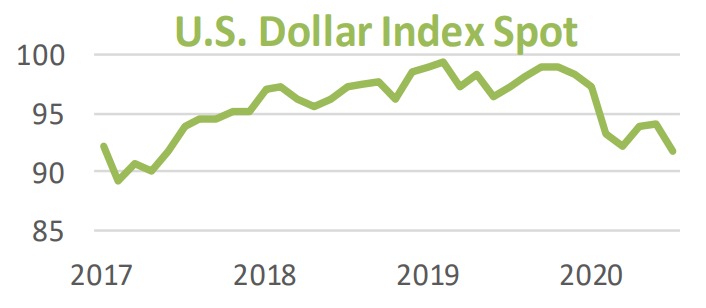
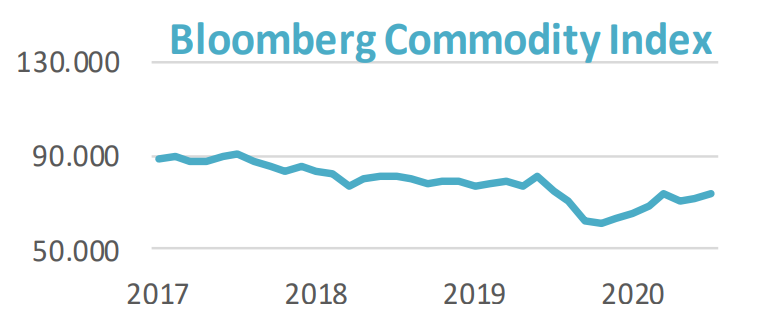
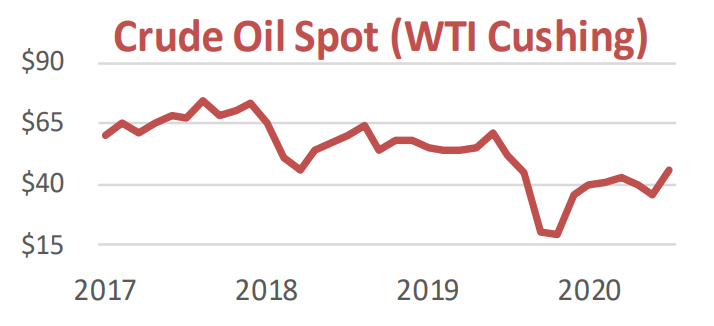
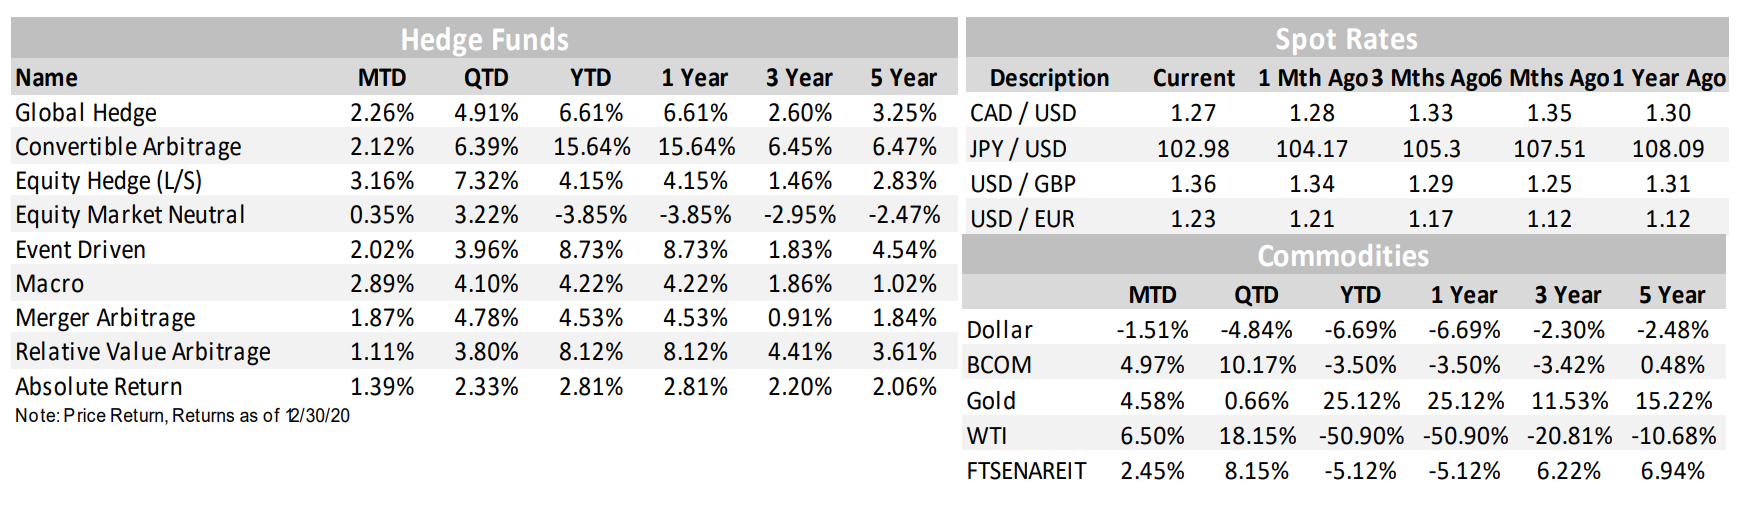
The US Dollar, as measured by the DXY Index, lost -1.51% in December and finished down -6.69% for the year. The Dollar’s weakness propelled commodities upward, as measured by the Bloomberg Commodities Index, which rose +4.97% on the month but finished the year down -3.50%. Whether the dollar continues to weaken in 2021, as is the consensus call, will be a major factor on how commodities perform over the coming year.
West Texas Intermediate (WTI) crude oil was up +6.50% in December to close at over $48/barrel on the NYMEX. However, WTI crude oil was one of the was worst performing alternatives and asset classes in 2020, down -50.90% for the year. In contrast to the poor performance of oil, renewable energy outperformed greatly and continued to gather interest as an asset class. The S&P Global Clean Energy Index, a subset of clean energy related publicly traded stocks, was up +139.5% in 2020. The new presidential administration should continue to support the growth of renewable energy and sustainable investing going forward.
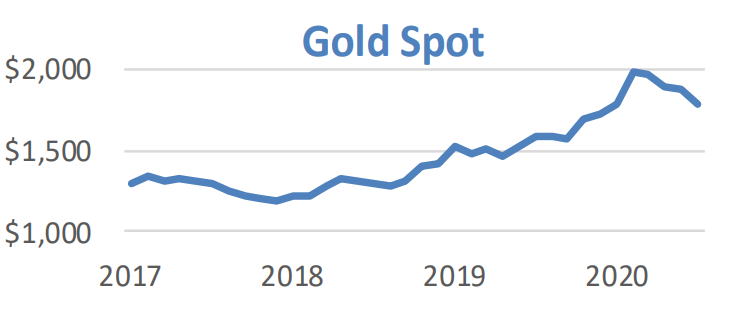
Gold was up +4.58% in December and was one of the best performing asset classes of 2020, up +25.12%. A lower for longer interest rate environment and a lack of other investable noncorrelated assets should support the price of gold as well as its place in portfolios for the foreseeable future.
Hedge Fund strategies performed well during the month, with all nine strategies tracked posting positive returns on average. Long/Short Equity Hedge strategies were the top performer, up +3.16% on the month, while Equity Market Neutral strategies were the worst performer, up only +0.35% during the period. Despite the recent performance, all strategies underperformed global equites, as measured by the ACWI Index in 2020.
ESG
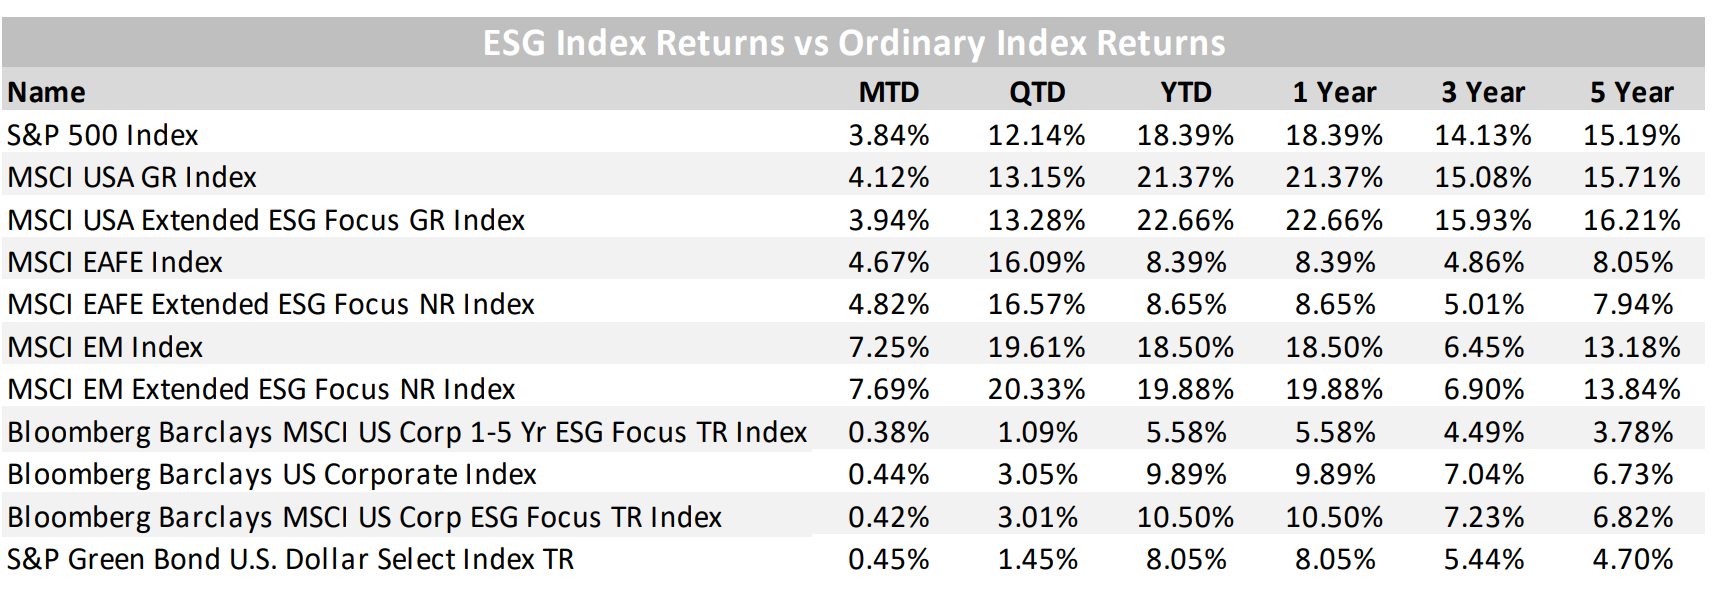
December was a strong month for ESG performance overall. The interest in ESG integrated investing continues to grow amongst investors and investment managers. This can be seen in the large asset inflows that have been experienced by ESG oriented funds, the rising number of ESG themed investment vehicles (particularly ETFs), and the increasing amount of investment research and literature that is being produced around ESG integration
strategies and data sources that can be used in investment research.
While 2020 was a momentous year for Environmental, Social, and Governance concerns, it is hard to imagine that they will be anywhere but front of mind in 2021. We have an incoming U.S. administration that will be significantly more accommodating than the prior. The world is in the midst of a vaccine rollout than hopes to quell a pandemic. Concerns about the gulf that has grown between those at the top and those at the bottom seem to be at a level never before witnessed, and governments (and central banks) are beginning to throw their weight behind regulations and interventions intended to improve this divergence. That makes it more important than ever to be conscious of the outcomes of these actions, many unquestionably pecuniary, influencing the bottom line for affected businesses.
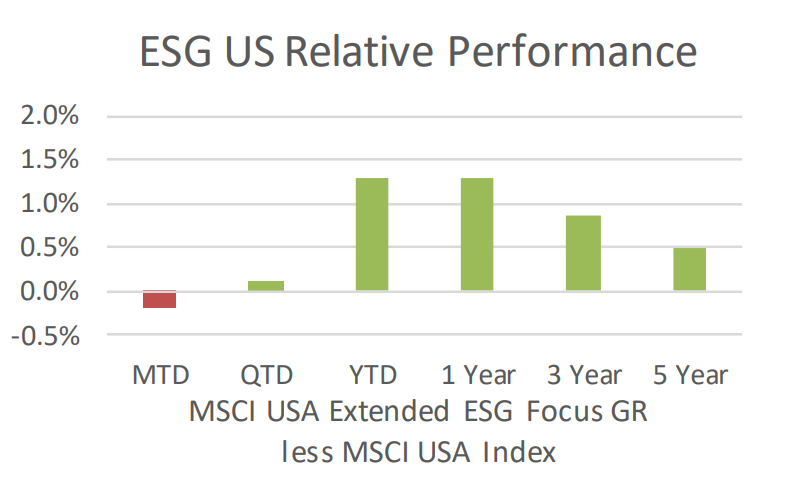
In December the U.S. ESG Index gave back a bit of its outperformance relative to its non-ESG counterpart, with
quarterly attribution remaining slightly positive. Longer performance time horizons continue to show ESG integration to be significantly additive to returns.
ESG EAFE again put up a nice monthly number, and continues to chip away at the negative attribution over five years. With Europe championing the Green transition and having a strong ESG regulatory focus, this trend appears likely to continue.
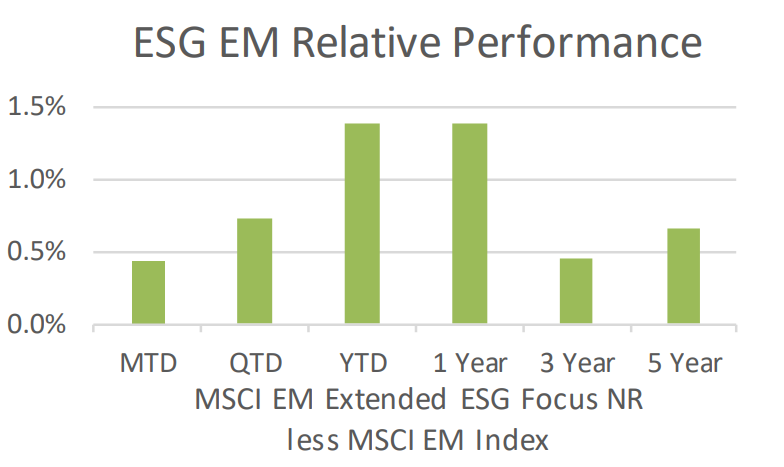
ESG EM continues to flash “green” over all time periods.
Originally published by Nottingham Advisors
Nottingham Advisors, Inc. (“Nottingham”) is an SEC registered investment adviser with its principal place of business in the State of New York. Nottingham and its representatives are in compliance with the current registration requirements imposed upon registered investment advisers by those states in which Nottingham maintains clients. Nottingham may only transact business in those states in which it is registered, or qualifies for an exemption or exclusion from registration requirements. This material is limited to the dissemination of general information pertaining to Nottingham’s investment advisory/management services. Any subsequent, direct
communication by Nottingham with a prospective client shall be conducted by a representative that is either registered or qualifies for an exemption or exclusion from registration in the state where the prospective client resides.
The information contained herein should not be construed as personalized investment advice. Past performance is no guarantee of future results. Information contained herein should not be considered as a solicitation to buy or sell any security. Investing in the stock market involves the risk of loss, including loss of principal invested, and may not be suitable for all investors. This material contains certain forward-looking statements which indicate future possibilities. Actual results may differ materially from the expectations portrayed in such forward-looking statements. As such, there is no guarantee that any views and opinions expressed in this letter will come to pass. Additionally, this material contains information derived from third party sources. Although we believe these sources to be reliable, we make no representations as to the accuracy of any information prepared by any unaffiliated third party incorporated herein, and take no responsibility therefore. All expressions of opinion reflect the judgment of the authors as of the date of publication and are subject to change without prior notice. Past performance is not an indication of future results.
The indices referenced in the Nottingham Monthly Market Wrap are unmanaged and cannot be invested in directly. The returns of these indices do not reflect any investment management fees or transaction expenses. Had these additional fees and expenses been reflected, the returns of these indices would have been lower. Information herein has been obtained from third party sources that are believed to be reliable; however, the accuracy of the data is not guaranteed by Nottingham Advisors. The content of this report is as current as of the date indicated and is subject to change without notice.
For information pertaining to the registration status of Nottingham, please contact Nottingham or refer to the Investment Adviser Public Disclosure web site (www.adviserinfo.sec.gov). For additional information about Nottingham, including fees and services, send for our disclosure statement as set forth on Form ADV from Nottingham using the contact information herein. Please read the disclosure statement carefully before you invest or send money.
