
SUMMARY
Buyer fatigue battles positive year-end seasonality and the fear of missing out. Which will prevail? While the NDR Catastrophic Stop Loss Model remains fully invested (bullish), prudence dictates identifying risk tolerance levels into year-end and, if necessary, tightening short-term stop-loss points.
SHORT-TERM MESS
Before September, certain internal measuring tools negatively diverged from Large Cap domestic equity market indices. Large Cap indices (the “Generals”) rose while many stocks (the “Troops”) dropped. Though it took some time to begin, the result was a sharp and fast price decline by Large Cap indices that for the most part ended in early October. At that point, stocks steadied, internal measuring tools reset and positively diverged, and a sharp rally ensued.
However, things have gotten messy again—Figures 1-3. New 52-Week Lows are expanding, and when this happens, it’s difficult to make money with individual stock positions. The percentage of stocks above various exponential moving averages is falling quickly and not close to an oversold level (OS, defined as 2 standard deviations below its 50-day MA). Also, the NYSE All Issues and S&P 500 A/D Line did not confirm the SPX’s closing high on 11/18/21. While it can easily be overcome, I still need to recognize it for what it is: negative short-term non-confirmation.
WHY THE MESS (IF LOOKING FOR A REASON)
While Day Hagan remains committed to an unemotional, model- and indicator-driven investment decision-making process, we understand wanting to know why stocks are trading as they are. I think JPM explained it well last Friday:
… reacting to news on surging COVID infections in the UK and Europe as Austria announced a lockdown… while Germany is thought to be considering the same… we are seeing flows migrate to secular growth names while the cyclical and re-opening names are under pressure. The big question for investors is how the post-Thanksgiving environment will develop given the low probability of mobility restrictions in the US.… The US Treasury markets will be closely watched to see if a potential new COVID wave impacts the inflation and rate hike narratives… and Fed leadership uncertainty.
Figure 1: It’s hard to explain these readings, especially since they occurred against most capitalization sizes. While I remain a bit skeptical, I don’t want to rationalize an indicator.
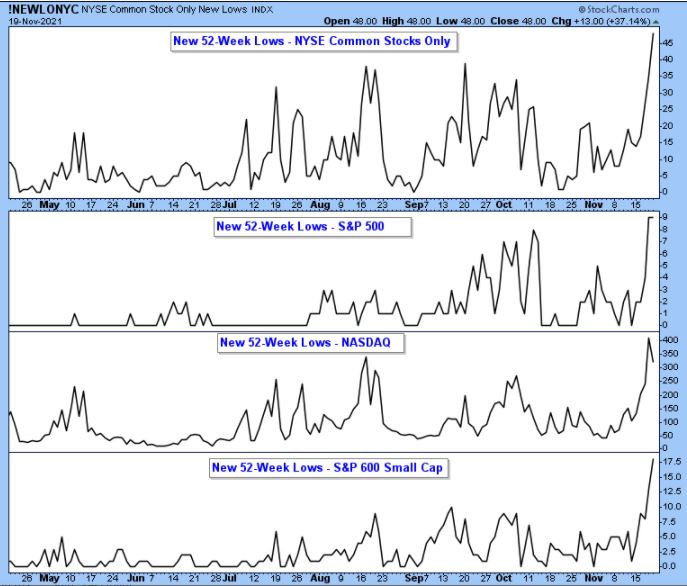
Figure 2: While certain internal measuring tools have reached oversold territory (McClellan Oscillator), these readings have not yet done so while also signifying a narrowing of participation.
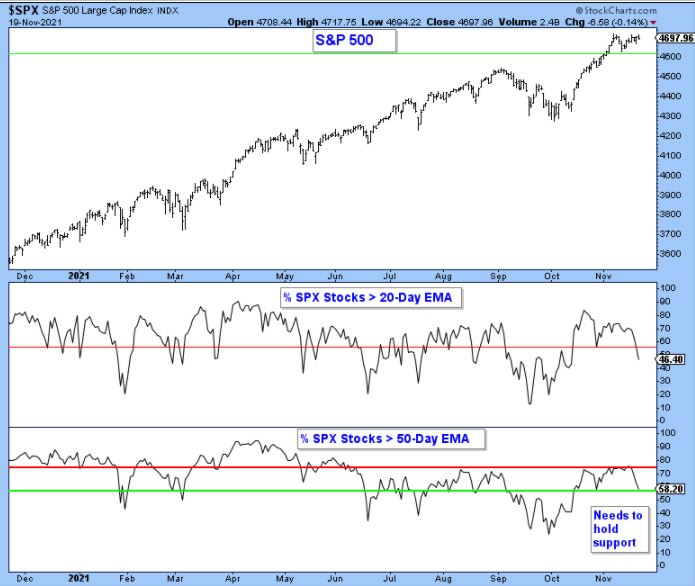
Figure 3: This non-confirmation is short term and can easily be overcome. Until it does, I need to recognize it and respect it. It also suggests being more cognizant, and respecting a violation, of support levels.

INDEX PRICE TREND: WHAT TO FOCUS ON NOW
Figure 4: Going into year-end, based on the recent topside breakout and favorable seasonal factors for Small Caps (reach out if you want to see the seasonal chart), I felt Small Caps would outperform into year-end, but that has not been the case! Are we experiencing a retest (bullish) or a failed breakout (bearish)? I think we are on the cusp of finding out as this Small Cap proxy is approaching an important pocket of support between 232 and 228. We will let price and our models be the arbiter, not one’s opinion.
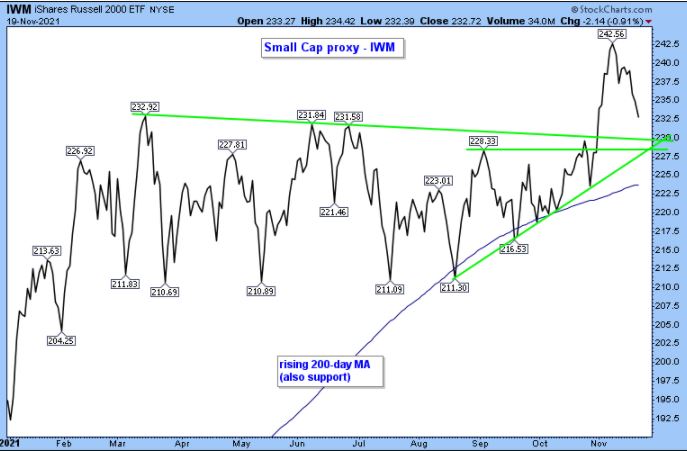
Figure 5: The SPX’s reaction to the morning news about Fed Chairman Powell caused the index to breakout above an area of resistance between 4700 and 4720. Given the cause of the breakout, it will be important that the SPX not fall back below 4720 (dashed green line) and at most not fall below the mid-point (approximately 4675—first short green line) of the base that had been established over the past few weeks. Holding these levels keeps the upward seasonal bias intact even with the market’s current disheveled condition. If these levels are violated, further downside volatility will be more likely.
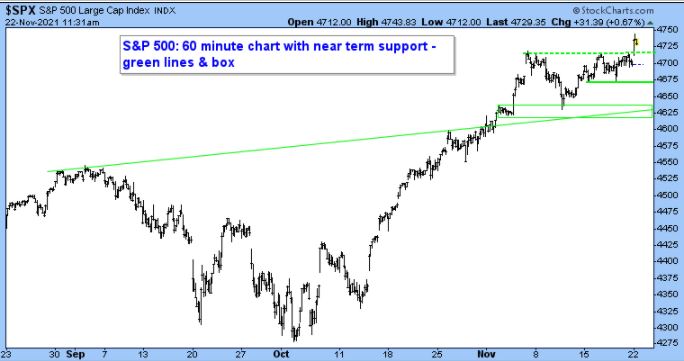
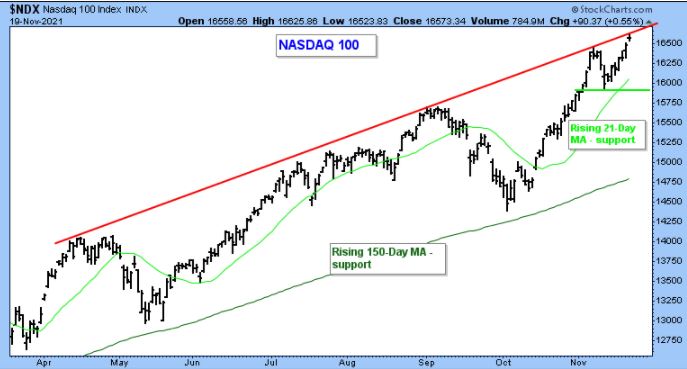
Figure 6: NASDAQ 100, the “hottest ticket in town.” A similar red resistance line recently helped identify a lid on the SPX (see webinar slides or reach out to me directly for a copy). Let’s see what happens here.
Day Hagan Asset Management appreciates being part of your business, either through our research efforts or investment strategies. Please let us know how we can further support you.
Art Huprich, CMT®
Chief Market Technician
Day Hagan Asset Management
—Written 11.21.2021. Chart and table source: Stockcharts.com unless otherwise noted.
UPCOMING EVENTS
- Day Hagan Market Update with Donald Hagan, CFA®, on December 8, 2021, at 4 p.m. ET
- Day Hagan Market Update with Donald Hagan, CFA®, on December 8, 2021, at 4 p.m. ET
- Day Hagan/Ned Davis Research Smart Sector® with Catastrophic Stop with Art Day, on December 9, 2021, at 4 p.m. ET
- Day Hagan Technical Analysis with Art Huprich, CMT®, on December 14, 2021, at 4 p.m. ET
Originally published by Day Hagan on November 22, 2021.
For more news, information, and strategy, visit the ETF Strategist Channel.
Disclosure: The data and analysis contained herein are provided “as is” and without warranty of any kind, either express or implied. Day Hagan Asset Management (DHAM), any of its affiliates or employees, or any third-party data provider, shall not have any liability for any loss sustained by anyone who has relied on the information contained in any Day Hagan Asset Management literature or marketing materials. All opinions expressed herein are subject to change without notice, and you should always obtain current information and perform due diligence before investing. DHAM accounts that DHAM or its affiliated companies manage, or their respective shareholders, directors, officers and/or employees, may have long or short positions in the securities discussed herein and may purchase or sell such securities without notice. The securities mentioned in this document may not be eligible for sale in some states or countries, nor be suitable for all types of investors; their value and income they produce may fluctuate and/or be adversely affected by exchange rates, interest rates or other factors.
Investment advisory services offered through Donald L. Hagan, LLC, a SEC registered investment advisory firm. Accounts held at Raymond James and Associates, Inc. (member NYSE, SIPC) and Charles Schwab & Co., Inc. (member FINRA, SIPC). Day Hagan Asset Management is a dba of Donald L. Hagan, LLC.
