
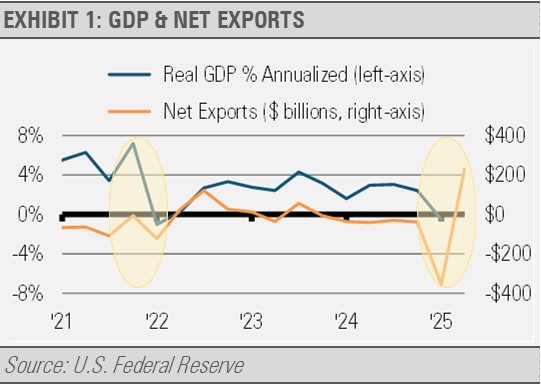
The U.S. economy remains resilient despite headline volatility tied to shifting trade and tariff policies. Meanwhile, we continue to see a lot of volatility in the economic data as the world adjusts to these changing policies. For example, following a 0.5% contraction in real GDP in the first quarter, second quarter GDP is tracking at a strong 2.6% annualized rate according to the Atlanta Fed’s GDPNow measure.
As we noted when first quarter GDP contracted, most of these swings are the result of massive shifts in net exports as imports spiked prior to the implementation of tariffs. To look through this noise and focus on the true state of the U.S. economy, we can monitor real final sales to domestic purchasers, which strips out the impact of global trade and inventory investment. Though real final sales to domestic purchasers slowed in the first quarter to 1.5%, the data is still firmly positive. Imports collapsed during the second quarter, which results in a strong net exports figure according to the Atlanta Fed’s Nowcast for Real Change of Net Exports of Goods and Services. This positive swing in net exports should contribute to a strong second quarter GDP reading.
Inflation remains relatively tame. M2 money supply growth has been subdued at around +4.5 % year over year compared to the previous cycle average of 6%. In exhibit 2, we can see the spike in the amount of money in the economy that resulted from the pandemic era government stimulus packages. This was the primary driver of the spike in inflationary pressures that we experienced.
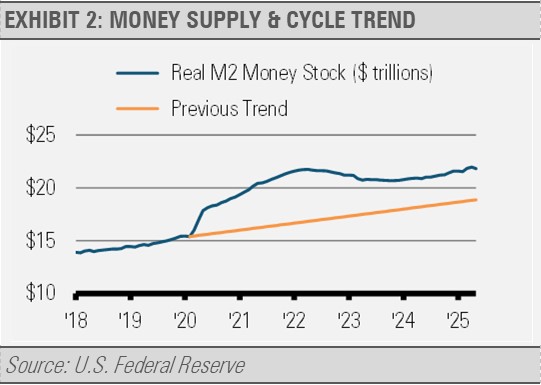
While inflation remains above the U.S. Federal Reserve’s (Fed) target, pricing pressures have eased significantly in recent months, which reinforces that slight M2 expansion, low final sales growth, and consistent real demand curb inflationary pressures.
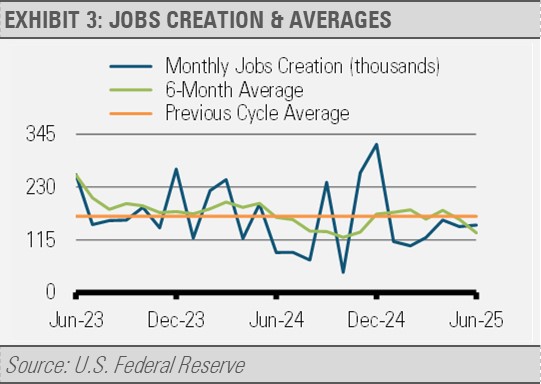
Similarly, jobs creation has slowed but is still positive. Monthly jobs figures can be quite volatile and subject to revision. Therefore, we compare the monthly jobs creation figures to the 6-month moving average as well as the average of the previous business cycle. This helps us see through the monthly volatility and gain a better perspective on the pace of jobs creation. Even at this slower pace, including the reduction in the federal workforce, the economy is still on pace to create more than 1.5 million net new jobs this year, which is enough to keep household incomes growing and support consumption and economic growth.
Looking ahead, we expect real GDP growth to slow. Yet, there are no immediate recessionary signals: low inflation, moderate growth in final sales, and a manageable money supply imply near term stability. Growth is slowing to a modest 1-2 % range, but with low inflation. Domestic demand remains the engine, and stabilization in trade policies should calm jittery markets over time.
Meanwhile, the weaker dollar has underpinned stronger foreign equity performance. In fact, roughly half of the foreign equity market outperformance year-to-date was due to the fall in the value of the U.S. dollar versus a basket of other currencies. As trade policies become clearer and the import distortion fades, we could see growth stabilize, domestic demand maintain its footing, and markets digest this backdrop positively. To address many of the questions we have been getting from people looking to increase exposure to foreign markets, while there are some excellent valuation opportunities, we would proceed with caution. Currencies can be volatile and are notoriously unpredictable. Their swings can have a significant and surprising impact on international asset returns, as we have seen during the first half of this year.
INVESTMENT IMPLICATIONS
Within our equity allocations, we remain overweight the U.S. relative to international markets, though our outlook for Europe has improved somewhat with higher expected fiscal stimulus. We continue to favor quality businesses that have exhibited consistent earnings growth and low financial leverage. Our largest sector overweights include financials, consumer staples, and information technology through the software industry.
On the fixed income side, we are focused on high quality intermediate duration corporate bonds and asset-backed securities. Our positioning in alternative assets emphasizes equity options overlay strategies for increased yield and downside protection. One of the many benefits of using ETFs in our fixed income allocations is that it allows us to diversify across the universe of fixed income opportunities, controlling both our duration and credit quality to take advantage of opportunities and manage risks.
We continue to focus our duration on the belly of the curve with an underweight to U.S. Treasuries while overweight asset-backed securities, corporate bonds, equity income, and options overlay strategies where appropriate.
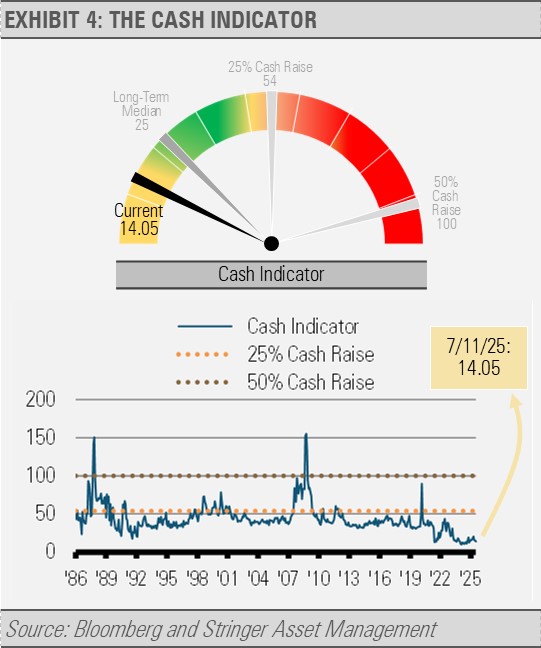
THE CASH INDICATOR
Turning to our Cash Indicator (CI), the volatility we saw in March and April caused the CI to rise above its long-term average but not to a level that would suggest that we raise significant amounts of cash. However, it is important to note that after prolonged periods of little fear and low volatility, even a jump back to the long-term average can be unnerving and represent a significant behavioral challenge to advisors and their clients. That’s why the CI as an objective measurement tool can be important in times of uncertainty. Without a gauge or reference point for which to measure volatility, investors might anchor on data points that may or may not be relevant to their plan or the overall health of the markets. This can lead to behavioral errors. We think it is critical to have a process like the CI when considering raising cash.
For more news, information, and strategy, visit the ETF Strategist Content Hub.
DISCLOSURES
Any forecasts, figures, opinions or investment techniques and strategies explained are Stringer Asset Management, LLC’s as of the date of publication. They are considered to be accurate at the time of writing, but no warranty of accuracy is given and no liability in respect to error or omission is accepted. They are subject to change without reference or notification. The views contained herein are not to be taken as advice or a recommendation to buy or sell any investment and the material should not be relied upon as containing sufficient information to support an investment decision. It should be noted that the value of investments and the income from them may fluctuate in accordance with market conditions and taxation agreements and investors may not get back the full amount invested.
Past performance and yield may not be a reliable guide to future performance. Current performance may be higher or lower than the performance quoted.
The securities identified and described may not represent all of the securities purchased, sold or recommended for client accounts. The reader should not assume that an investment in the securities identified was or will be profitable.
Data is provided by various sources and prepared by Stringer Asset Management, LLC and has not been verified or audited by an independent accountant.
Index Definitions:
S&P 500 Index – This Index is a capitalization-weighted index of 500 stocks. The Index is designed to measure performance of a broad domestic economy through changes in the aggregate market value of 500 stocks representing all major industries.
