
By Art Huprich, CMT
SUMMARY
As the Fed goes into a quiet period prior to the FOMC meeting (policy decision 5/4/22) equity markets stalled at resistance, broke support, and fell close to major support. Following yesterday’s reversal, the short term “pain trade” may be higher? Quality follow-through is key.
PRICE REJECTED AT RESISTANCE & DOWN TO SUPPORT
Hakeem Olajuwon, nicknamed “the Dream,” was a 12-time All-Star in the National Basketball Association (NBA). “The Dream” was named one of the NBA’s 50 greatest players and inducted into the Naismith Memorial Basketball Hall of Fame. He played most of his career for the Houston Rockets. While “the Dream” was multi-talented, he was especially notable for being the all-time leader in blocked shots. He prevented many scoring opportunities. Similarly, on Wall Street last week many domestic equity market indices rallied up to areas of selling pressure (resistance) only to get “blocked” and turned lower—Figure 1. Heavy and broad-based selling followed. NYSE declining volume led advancing volume by 10-1 last Friday as growth, commodity, and defensive areas were sold down—not usually a supportive sign for equities.
Figure 1: S&P 500 Large Cap Index. Shorter-term perspective with declining 100-day MA | Watch 4200 to 4157, a range of support that held during the January to March lows.
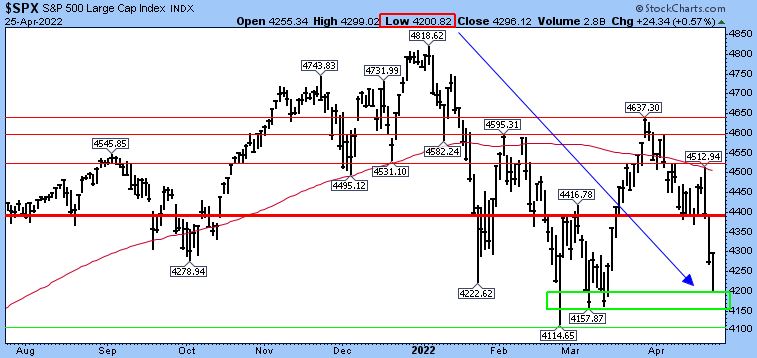
Figure 2: S&P 500 Large Cap Index. Longer-term perspective | A decisive break of support accompanied by poor internal readings or a reversal to down by the NDR Catastrophic Stop Loss Model would open something closer to the pre-COVID highs from 2020.
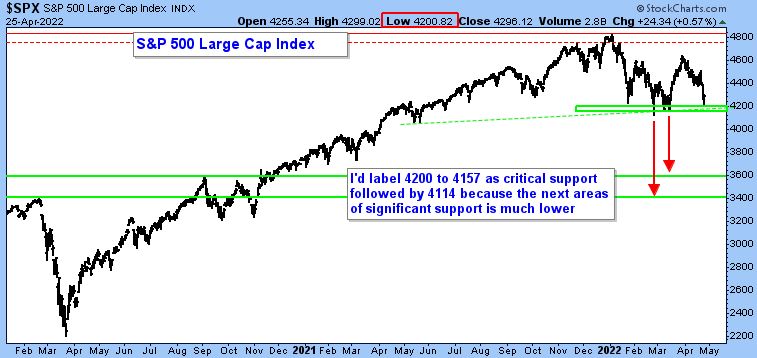
Figure 3: NASDAQ Composite—growth proxy (quality and non-quality). Longer-term perspective | A breakdown below support could get very ugly very fast! Until the long-term 40-week MA stops declining, I wouldn’t be surprised by a break.

Figure 4: iShares Russell 2000 ETF (IWM) – Small cap proxy. Longer-term perspective | A break of support between 188 and 187.55 could get ugly very fast. Until the declining 200-day MA stabilizes and flattens out (not shown on chart—reach out if you would like to see it), I wouldn’t be surprised by a break.
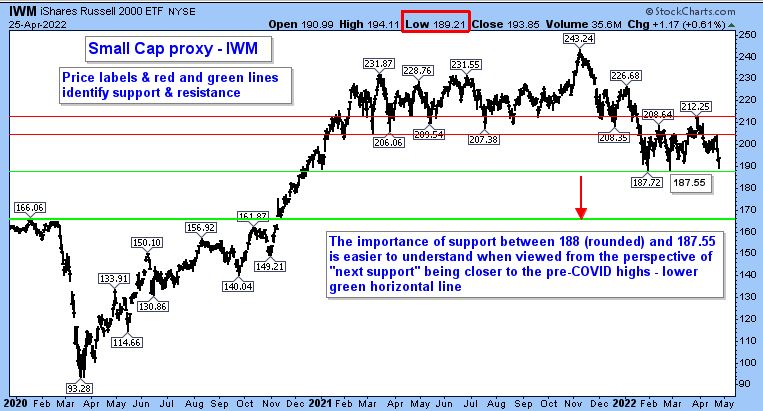
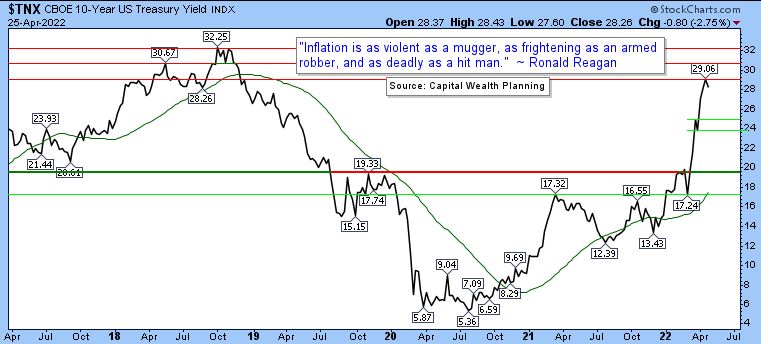
Figure 5: CBOE 10-Year U.S. Treasury Yield Index (TNX). | Rejected at resistance (red horizontal lines) as “The Dream” shows up again. But for how long? A move through 29.06 (2.906%) may cause some angst, but a move above 30.67/32.25 (3.067%/3.225%) may send a shudder through markets.
TWO ADDITIONAL CULPRITS
- According to JPM, “The market is now expecting four, 50-basis point hikes by September, beginning with the May 15 FOMC meeting.” Bespoke went further and stated, “Pricing is now suggesting a 50-basis point hike at the May meeting, a 75-basis point hikeat the June meeting, and another 50-basis point hike at the July meeting. That would take the Fed Funds Rate up to 2-2.25% by mid-July.”
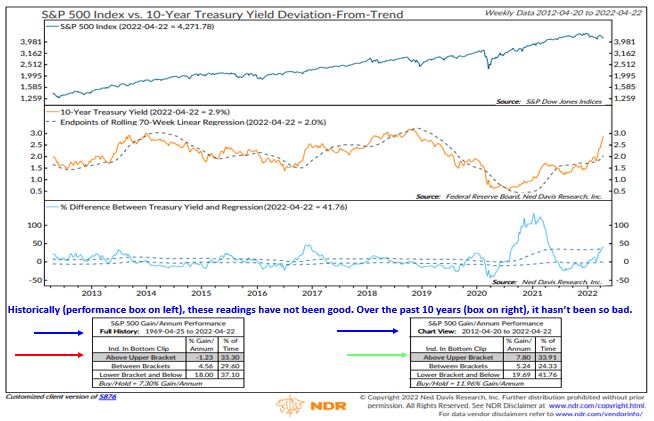
Figure 6: S&P 500 Index versus 10-Year Treasury Yield Deviation from Trend (please reach out for specifics on this indicator). | “While the Fed has only raised rates once, by a minuscule 0.25%, other rates in the U.S. are now at levels that have historically been a problem for the stock market.” ~Ned Davis Research
- Possibly adding to Wall Street’s angst is the following, according to Jeff Hirsch of the invaluable The Stock Trader’s Almanac: “The market’s performance this April stands in stark contrast to past historical performance in midterm years. Typically, at this point in midterm-year Aprils all four indexes have been positive on average. Current weakness during the usually bullish month of April is a concern as it demonstrates the elevated levels of uncertainty hanging over the market and the potential for even more pronounced weakness…”
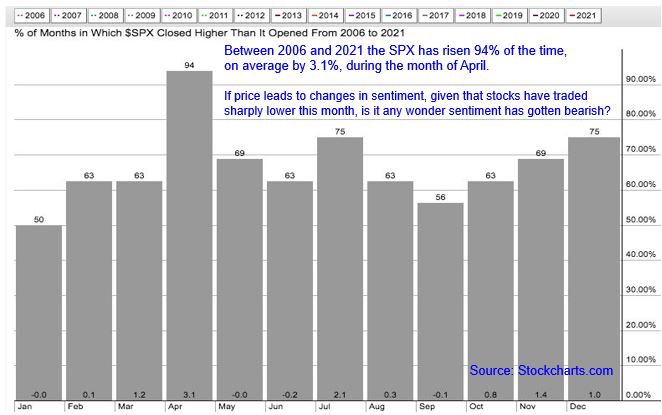
Figure 7: Percentage of Months in which the S&P 500 closed higher than it opened – 2006 to 2021. | While the odds favored higher prices during the month of April as shown below, considering how poorly stocks have traded thus far in April, a pickup in bearish sentiment shouldn’t be surprising.
Day Hagan Asset Management appreciates being part of your business, either through our research efforts or investment strategies. Please let us know how we can further support you.
Art Huprich, CMT®
Chief Market Technician
Day Hagan Asset Management
—Written 04.25.2022. Chart source: Stockcharts.com unless otherwise noted.
UPCOMING EVENTS
Day Hagan Technical Analysis with Art Huprich, CMT, May 10, 2022, at 4:15 p.m. EDT
Disclosure: The data and analysis contained herein are provided “as is” and without warranty of any kind, either express or implied. Day Hagan Asset Management (DHAM), any of its affiliates or employees, or any third-party data provider, shall not have any liability for any loss sustained by anyone who has relied on the information contained in any Day Hagan Asset Management literature or marketing materials. All opinions expressed herein are subject to change without notice, and you should always obtain current information and perform due diligence before investing. DHAM accounts that DHAM, or its affiliated companies manage, or their respective shareholders, directors, officers and/or employees, may have long or short positions in the securities discussed herein and may purchase or sell such securities without notice. The securities mentioned in this document may not be eligible for sale in some states or countries, nor be suitable for all types of investors; their value and income they produce may fluctuate and/or be adversely affected by exchange rates, interest rates or other factors.
Investment advisory services offered through Donald L. Hagan, LLC, a SEC registered investment advisory firm. Accounts held at Raymond James and Associates, Inc. (member NYSE, SIPC) and Charles Schwab & Co., Inc. (member FINRA, SIPC). Day Hagan Asset Management is a dba of Donald L. Hagan, LLC.
