SUMMARY
Friday’s decline wasn’t as broad or intense as earlier in the week, but it was concentrated—the start to a potential Low? But unless a sustainable rally occurs from the current oversold condition or strong demand statistics occur, please don’t dismiss a “mini Q4 2018” scenario.
A TOUGH WEEK FOR DOMESTIC EQUITIES
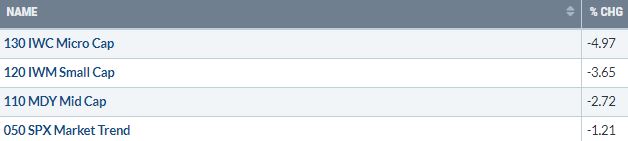
President Teddy Roosevelt once said, “Risk is like fire: If controlled it will help you. If uncontrolled it will rise up and destroy you.” We have been advising risk management since internal price divergences occurred weeks ago. Considering the following performance statistics relative to last week (Figure 1), I still think it is prudent to discuss one’s tolerance for risk, and how to manage it.
Figure 1: Weekly Performance statistics (as of 12/3/21). | Besides the statistics below, NDR reported that, as of 12/1/21, while the SPX was 4% below a one year high, almost 24% of the S&P 500 stocks were down 20% or more from a one-year high.
Bottom Line: Almost 24% of the stocks in the S&P 500 are in their own bear market as defined by a 20% or more pullback. Said another way, serious carnage within the domestic equity market has already been occurring despite limited price declines by most major domestic equity market indices.
Also, while the CRB Index is heavily weighted by energy, it declined almost 2.7% last week
INTERNAL LOW VERSUS INDEX LOW/BOTTOM
In many instances, as equity market indices/proxies are attempting to establish an initial Low or develop a Bottom, the internal price low/selling intensity occurs prior to the actual index Low/Bottom—please reach out if you would like to discuss why this is the case.
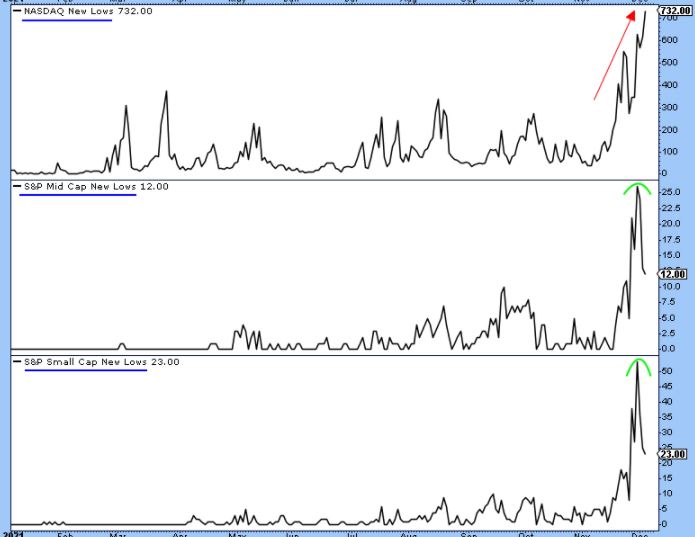
Figure 2: New 52-Week Lows. | Besides NASDAQ, where a lot of the selling occurred last Friday, New 52-Week Lows contracted last Friday as equity market indices/proxies sold off and retested previous price lows.
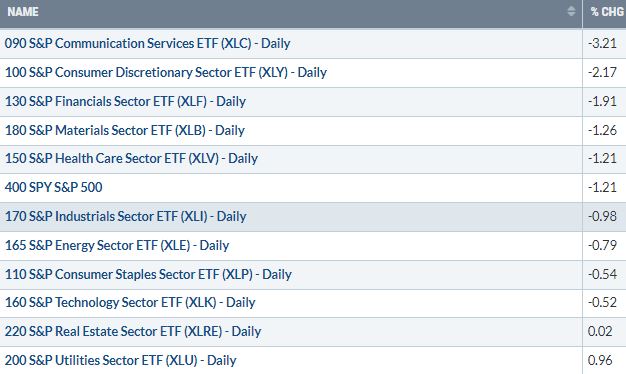
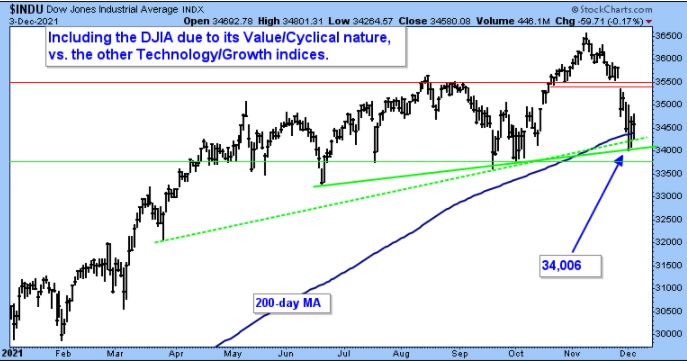
Last Friday, the NYSE FANG Index fell almost 3.6%, Small Cap proxy lost over 2%, and NASDAQ declined1.9%, yet the value/cyclical oriented DJIA hardly fell, down 0.17%. Despite this, and besides the New Low charts shown above, the percentage of NYSE, SPX, Mid-Cap, and Small Cap stocks above their respective 20- and 50-day simple or exponential moving averages did not set a new low—please reach out for a chart. This confirms that last Friday’s decline was concentrated and not as broad or intense as what occurred earlier in the week. When combined with an oversold condition (please reach out for a chart of the McClellan oscillator) and increasing bearish sentiment (sentiment is becoming a tailwind, no longer a headwind), an internal Low may have been established or a Bottom may be developing.
Bottom Line: Besides needing Credit Spreads, which have been expanding (bearish), to contract, please refer to the Summary below for what I believe needs to occur next for some stability and normalcy (I know, I know, “what is normal,” you ask) to return to the domestic equity market.
SANDMAN – LINES IN THE SAND SUPPORT
The Sandman is a comic book published by DC Comics. One of the “themes of The Sandman is the struggle for freedom from forces both external and internal.”
In this report, “struggle for freedom” references the domestic equity market’s struggle to hold support, which thus far has occurred, excluding the technology-heavy NASDAQ. “External forces” reference Wall Street contending with the media blitz about the new Covid variant and the efficacy of vaccines in relation to it, as well as Fed Chair Jerome Powell’s change in mindset and policy. “Internal forces” refer to the poor underlying tape action that had been occurring for weeks, discussed above.
Figure 3: S&P 500 Large Cap Index Daily. | During the September-October decline, the 100-day MA (blue line) provided an area from which a Bottom developed. While the “external forces” backdrop is different now, I would label it and the area between 4513 and 4491 as “Line in the Sand” support.
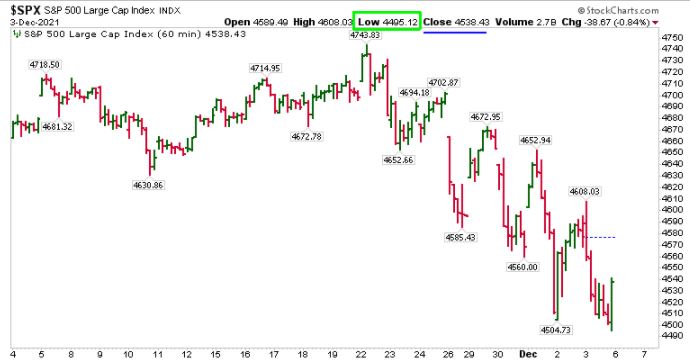
Figure 4: S&P 500 Large Cap Index 60 Minute. | One necessity is a break of the pattern of lower price peaks. Please use the levels shown on the chart for reference—there is still work to do.
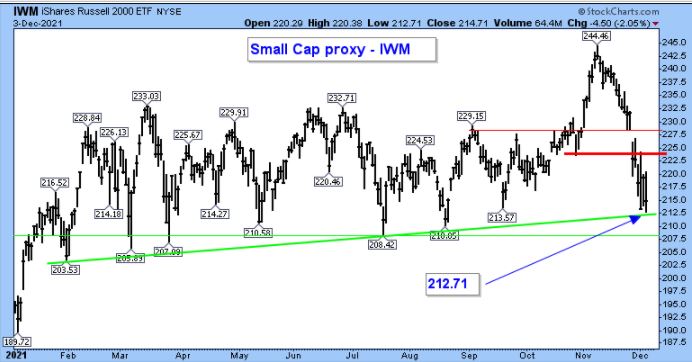
Figure 5: iShares Russell 2000 ETF (Small Cap proxy). | “Line in the Sand” support levels are depicted by the green lines and previous price lows shown on the chart. At the same time, resistance levels (areas of selling pressure) are highlighted by the red lines.
Figure 6: Dow Jones Industrial Average. | While the most immediate reaction low at 34,006 would be considered “Line in the Sand” support, additional levels of support are depicted by the green lines and rising 200-day MA. Meanwhile, resistance levels (areas of selling pressure) are highlighted by the red lines.
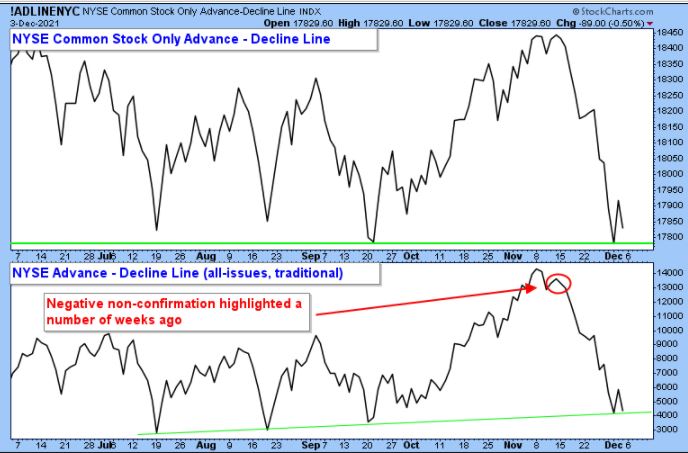
Figure 7: NYSE Advance Decline Lines – All Issues and Common Stock Only. | While I believe A/D Line analysis is much more effective in discerning equity market tops, I wanted to include this chart because another “Line in the Sand” support level is evident—green lines.
As we approach the end of 2021, the team at Day Hagan Asset Management thanks you for your interest in our research and investment strategies. If you have any feedback, please reach out and let us know how we can improve our research reports, investment strategy updates, and online events to help your investment, trading, and risk management discipline in 2022.
Art Huprich, CMT®
Chief Market Technician
Day Hagan Asset Management
—Written 12.05.2021. Chart and table source: Stockcharts.com unless otherwise noted.
Disclosure: The data and analysis contained herein are provided “as is” and without warranty of any kind, either express or implied. Day Hagan Asset Management (DHAM), any of its affiliates or employees, or any third-party data provider, shall not have any liability for any loss sustained by anyone who has relied on the information contained in any Day Hagan Asset Management literature or marketing materials. All opinions expressed herein are subject to change without notice, and you should always obtain current information and perform due diligence before investing. DHAM accounts that DHAM or its affiliated companies manage, or their respective shareholders, directors, officers and/or employees, may have long or short positions in the securities discussed herein and may purchase or sell such securities without notice. The securities mentioned in this document may not be eligible for sale in some states or countries, nor be suitable for all types of investors; their value and income they produce may fluctuate and/or be adversely affected by exchange rates, interest rates or other factors.
Investment advisory services offered through Donald L. Hagan, LLC, a SEC registered investment advisory firm. Accounts held at Raymond James and Associates, Inc. (member NYSE, SIPC) and Charles Schwab & Co., Inc. (member FINRA, SIPC). Day Hagan Asset Management is a dba of Donald L. Hagan, LLC.