
SUMMARY
We discussed the domestic equity market’s internal deterioration for many weeks before 2022. Now that Wall Street is all lathered up about it, let’s withhold emotion and see if anything positive is happening, albeit short-term.
What We Have Experienced
For the week, here is how the domestic equity indices closed: value/cyclical oriented DJIA +1.34%, large cap technology-weighted S&P 500 +0.77%; NASDAQ 100 +0.11%; growth heavy with many companies that have little or no earnings NASDAQ +0.01%; and the Small Cap proxy (IWM), with many components that may be hurt by rising interest rates/weak economy, -0.88%. Clearly there was a lot of intraday and day-to-day volatility, something for which I look to identify the cessation of an existing trend and/or a trend change.
Additionally, the domestic equity market has experienced the following:
- Price Extreme: Last week NASDAQ recorded a “trifecta extreme” (Figure 1). 1) It reached an oversold level using weekly stochastics. 2) Using Bollinger Bands, it was almost two standard deviations below its 50-day MA. 3) It recorded a 10-week downside rate of change (ROC) consistent with previous lows going back to 2011. A Small Cap proxy (IWM) recorded similar readings last week relative to points 1 and 3, yet, in using Bollinger Bands, IWM was almost six standard deviations below its 50-day MA at its worst.
- Volume Extreme: Volume readings last week for the following domestic equity market proxies exceeded those recorded at previous lows in 2018, 2019, 2020, and 2021: QQQ, DIA, IWM, and VTI. Figure 2. This doesn’t mean indiscriminate selling (panic-fear-capitulation) can’t occur again. It can. What it does imply is that for now, the odds favor that a short-term price low was set. Note: SPY did not record a volume extreme, as described above, to the same degree as QQQ, DIA, IWM, and VTI.
- Internal Extreme (no charts): Based on the percentage of stocks above 10-day MA (short-term) and 50-day MA (intermediate term), extreme levels were reached at the close last Thursday by NASDAQ. As for SPX the percentage of stocks above the 50-day MA reached 28%, below the first line of demarcation of 30%. Good, yet still above oversold levels reached at previous significant, non-COVID related lows in 2011, 2015/16, and 2019. Longer-term extremes, using the 200-day MA, are still a long way away. While the NASDAQ and SPX (both technology heavy) recorded a lower price low on 1/25/22 and 1/27/22, there were fewer new 52-week lows on those days than what was recorded on 1/24/22. A minor positive divergence. This was not the case for the small and mid-cap complex.
- Sentiment Extreme (no charts): Having discussed NDR’s Daily Trading Composite, survey readings, and Put-Call readings, let’s consider the observations of Jason Goepfert, founder of the ever-valuable SentimenTrader website, “Heading into the weekend, there had never been more put options traded on U.S. exchanges… we’ve found the most value in watching opening transactions among the smallest of traders. Last week, they spent 27% of their volume purchasing put options to open (meaning not closing out a previous trade). That’s one of the highest readings in the past 20 years… high levels of put buying tended to lead to positive returns in the S&P 500 over the next 2-3 months.” Regardless of which sentiment indicator you prefer, bearish sentiment is extreme in certain cases and getting there in other cases. I continue to believe sentiment extremes will play a role in igniting short-term moves in the equity markets during 2022, in both directions.
- Sentiment extremes in and of themselves don’t cause a directional change in the equity market. What they suggest in this case, given the current degree of pessimism, is that there is a lot of potential energy stored up, which can help the market rebound as investors and traders sitting on the sidelines turn into buying pressure as they see a reversal higher—a catalyst can quickly turn fear into greed.
Note: The “extremes” discussed above are not close to the levels reached during the March 2020 COVID decline.
Bottom Line (short-term only): A Low is a function of price. Last week’s extremes aided in setting a short-term Low. A Bottom is a function of price and time, something akin to a “W” pattern. This pattern developed last week also, but for the short-term pattern to be completed there needs to be a decisive move above last Wednesday’s,1/26/22, intraday high—Figure 3. In this scenario I don’t want to see sentiment quickly turn back to “bullishness.” The longer a “wall of worry” exists, the better.
Considering the short-term “extremes” highlighted above, a more meaningful bottom (something more than short-term) would include A) a longer, more drawn-out “W” base building pattern (weeks to develop as opposed to a matter of days, which was the case last week) with stable to improving internal readings, B) Upside momentum surge/Breadth Thrusts, or C) a combination of the two.
Absent points A through C, considering the short-term extremes (extremes should produce a rally. If they don’t, “There’s trouble in River City”), the odds are that a meaningful price Low has not been recorded.
Figure 1: NASDAQ Composite (COMPQ). | By reaching oversold, deviation from mean, and rate of change extremes, the NASDAQ recorded a trifecta last week.
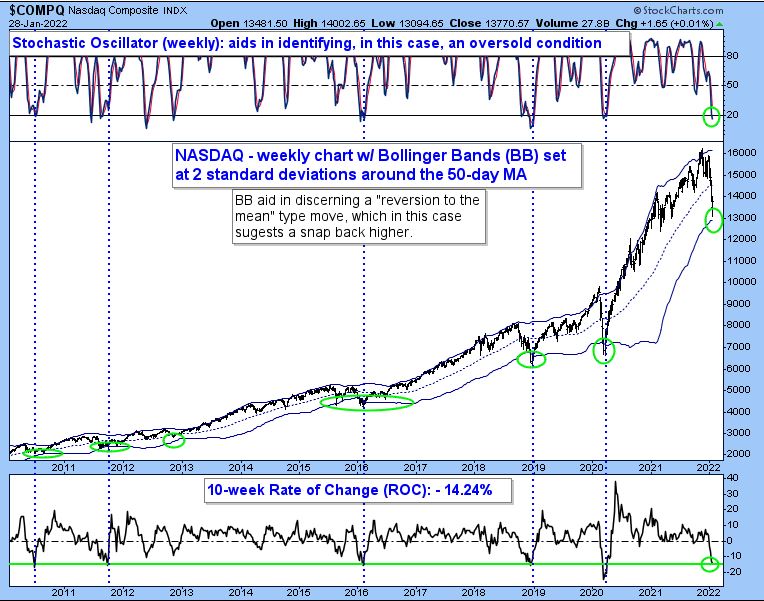
Figure 2: Invesco QQQ Trust (QQQ). | Downside selling pressure (1-800-GET-ME-OUT selling) comparable to what occurred in and around previous lows going back a few years.
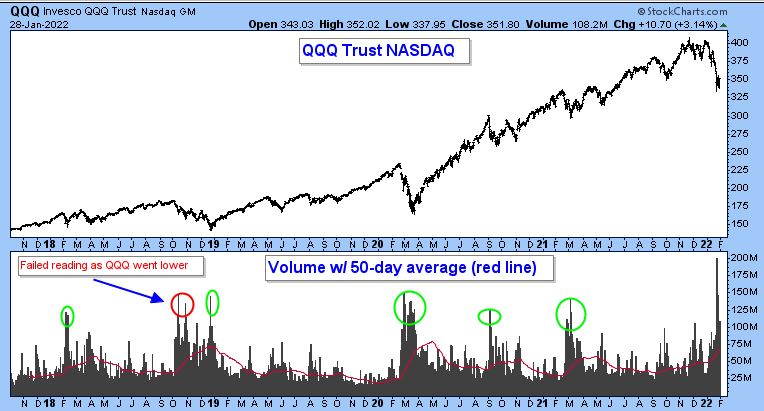
Figure 3: S&P 500 Large Cap Index (SPX). | While many layers of additional overhanging selling pressure exist (resistance), the first important short-term level of resistance is 4453.23.
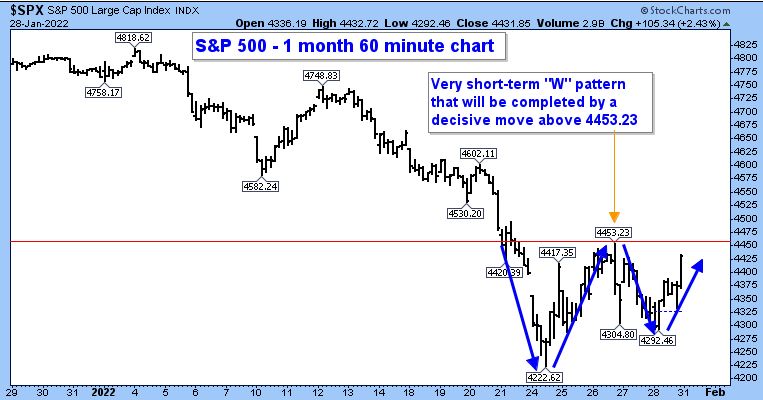
Note: Relative to other domestic equity market indices/proxies, the intraday high recorded last week is an important short-term resistance point for them as well.
Note 2: For additional resistance levels relative to the SPX or charts for other domestic equity market indices/proxies, please reach out anytime.
Day Hagan Asset Management appreciates being part of your business, either through our research efforts or investment strategies. Please let us know how we can further support you.
Art Huprich, CMT®
Chief Market Technician
Day Hagan Asset Management
—Written 01.22-23.2022. Chart source: Stockcharts.com unless otherwise noted.
Disclosure: The data and analysis contained herein are provided “as is” and without warranty of any kind, either express or implied. Day Hagan Asset Management (DHAM), any of its affiliates or employees, or any third-party data provider, shall not have any liability for any loss sustained by anyone who has relied on the information contained in any Day Hagan Asset Management literature or marketing materials. All opinions expressed herein are subject to change without notice, and you should always obtain current information and perform due diligence before investing. DHAM accounts that DHAM, or its affiliated companies manage, or their respective shareholders, directors, officers and/or employees, may have long or short positions in the securities discussed herein and may purchase or sell such securities without notice. The securities mentioned in this document may not be eligible for sale in some states or countries, nor be suitable for all types of investors; their value and income they produce may fluctuate and/or be adversely affected by exchange rates, interest rates or other factors.
Investment advisory services offered through Donald L. Hagan, LLC, a SEC registered investment advisory firm. Accounts held at Raymond James and Associates, Inc. (member NYSE, SIPC) and Charles Schwab & Co., Inc. (member FINRA, SIPC). Day Hagan Asset Management is a dba of Donald L. Hagan, LLC.
