
SUMMARY
The NDR S&P 500 Cycle Composite for 2022 shows a very bumpy first few months of the year, with a lot of movement in both directions. Continue to manage equity market and fixed income volatility.
2022 VOLATILITY: INDEX & STOCK, INFLATION & EXPECTATIONS…
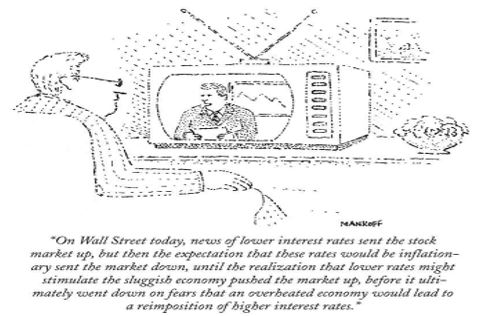
The cartoon above about sums things up. We left 2021 expecting more volatility in 2022 in the following areas: equity market indices and individual stocks, inflation and inflation expectations, and economic reports. In our January 4 Tech Talk report, we asked how Wall Street will balance an overbought condition and defensive sectors outperforming in December, leading to a market pause/decline, and ‘New Year inflows.’ It feels like we have gotten our answer.
During last week’s tape action, JPMorgan wrote, “almost 40% of the companies in the NASDAQ have seen 50% corrections off their 52-week highs.” Ned Davis Research pointed out a few weeks ago that over 20% of the stocks in the S&P 500 were down 20% or more from a one-year high, and Bespoke Investment Group stated yesterday, “the average Russell 3000 stock was already 27.2% below its 52-week high.”
I would describe the current near-term condition of the domestic equity market as washed out, with equity market volatility on both an index and stock level. In my opinion only, equity market and fixed income volatility can at least in part be managed if coupled with the Day Hagan/Ned Davis Research Smart Sector with Catastrophic Stop Loss Strategy and the Day Hagan/Ned Davis Research Smart Sector Fixed Income Strategy. Please reach out for specifics.
THANK GOODNESS FOR LONG-TERM MOVING AVERAGES
Let’s identify areas—not necessarily a specific point—of underlying support (green highlights and blue arrows) and areas of resistance (red highlights).
Figure 1: NASDAQ Composite (COMPQ). | While the NASDAQ Index itself recorded a new intraday low yesterday, on a stock basis the selling wasn’t as extreme as it had been when measuring Declining Volume and Declining Issues on the NASDAQ—a positive non-confirmation and a sign that the NASDAQ was washed out. Yesterday’s one-day upside reversal was a good example. More chart repair work is needed, but support was tested and held after some major angst (volatility).
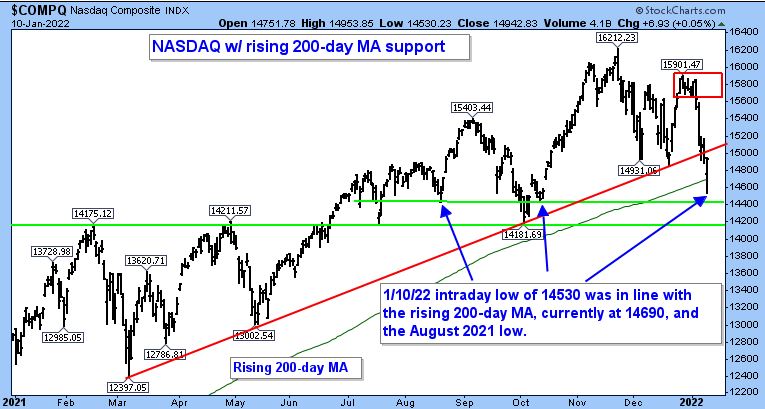
Figure 2: NASDAQ 100 Index (NDX). | Yesterday’s trading was like trying to discern the NFL’s playoff picture last weekend—a LOT of volatility with surprising outcomes. However, like the NFL, there was a final outcome. Moving average support was tested and, coupled with a lot of angst (volatility), held.

Figure 3: S&P 500 Large Cap Index Daily (SPX). | Almost on cue, the long-term rising 100-day moving average (support) held. I would prefer a further period of base building occurs (lateral price movement), allowing many charts time to repair by working through overhanging selling pressure.
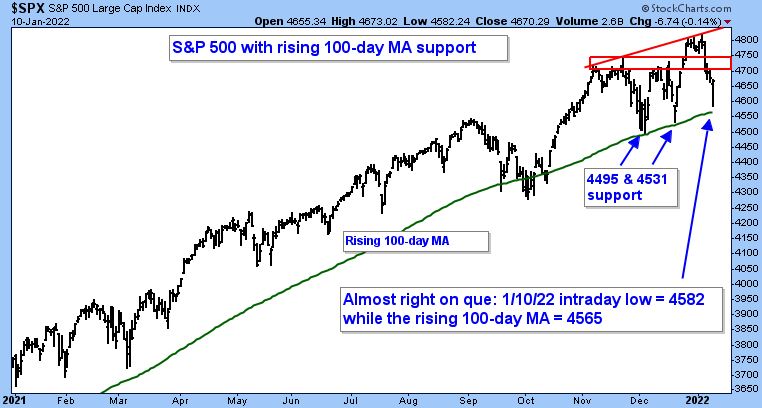
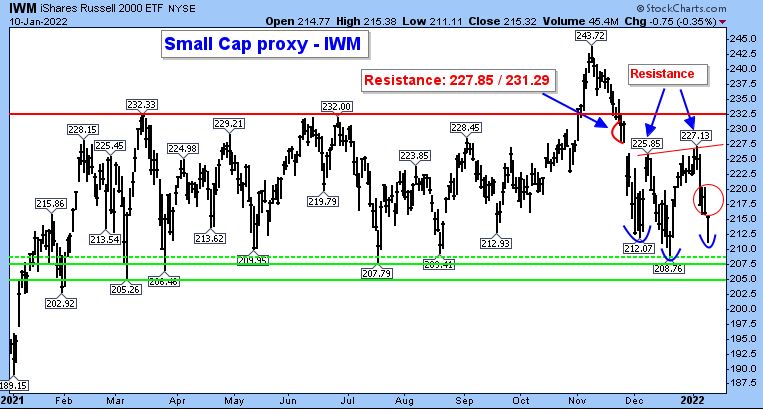
Figure 4: iShares Russell 2000 ETF (Small Cap proxy). | I apologize for the busyness of this chart, but I believe it is necessary given the importance this complex plays in many internal measuring tools. Please reach out for a deeper discussion. Asking for a friend: “Do I see a potential bullish inverse pattern of accumulation developing (blue horseshoes)?”
Day Hagan Asset Management appreciates being part of your business, either through our research efforts or investment strategies. Please let us know how we can further support you.
Art Huprich, CMT®
Chief Market Technician
Day Hagan Asset Management
—Written 1.10.2022. Chart and table source: Stockcharts.com unless otherwise noted.
UPCOMING EVENTS
- Day Hagan Technical Analysis with Art Huprich, CMT, on January 18, 2022, at 4:15 p.m. ET
- Day Hagan/Ned Davis Research Smart Sector 2021 Review and NDR Catastrophic Stop Update with Art Day, on January 13, 2022, at 1:15 p.m. ET
- Day Hagan/Ned Davis Research Smart Sector 2021 Review and NDR Catastrophic Stop Update with Art Day, on January 13, 2022, at 4:15 p.m. ET
- Day Hagan Market Update with Donald Hagan, CFA, on February 9, 2022, at 4:15 p.m. ET
For more news, information, and strategy, visit the ETF Strategist Channel.
Disclosure: The data and analysis contained herein are provided “as is” and without warranty of any kind, either express or implied. Day Hagan Asset Management (DHAM), any of its affiliates or employees, or any third-party data provider, shall not have any liability for any loss sustained by anyone who has relied on the information contained in any Day Hagan Asset Management literature or marketing materials. All opinions expressed herein are subject to change without notice, and you should always obtain current information and perform due diligence before investing. DHAM accounts that DHAM or its affiliated companies manage, or their respective shareholders, directors, officers and/or employees, may have long or short positions in the securities discussed herein and may purchase or sell such securities without notice. The securities mentioned in this document may not be eligible for sale in some states or countries, nor be suitable for all types of investors; their value and income they produce may fluctuate and/or be adversely affected by exchange rates, interest rates or other factors.
Investment advisory services offered through Donald L. Hagan, LLC, a SEC registered investment advisory firm. Accounts held at Raymond James and Associates, Inc. (member NYSE, SIPC) and Charles Schwab & Co., Inc. (member FINRA, SIPC). Day Hagan Asset Management is a dba of Donald L. Hagan, LLC.
