
Summary
Narrow leadership, comparable to what we have seen since the beginning of 2023, is worrisome. Bob Farrell once said, “Markets are strongest when they are broad, and weakest when they narrow to a handful of blue-chip names.” Also, the small positive divergence in “Small-Cap land” must be built on!
Hello? (Hello? Hello?)
Hello? (Hello? Hello?)
Is there anybody in there?
Just nod if you can hear me
Is there anyone home?
Come on now
I hear you’re feeling down…
…Can you show me where it hurts?
– Comfortably Numb, Pink Floyd, 1979
And where does it hurt? How about the jawboning between Powell and Yellen—he said, she said, he said, she said. My head hurt just listening to it. Powell reiterated multiple times that “rate cuts this year are not the Fed’s base case expectation” and “given our outlook, I just don’t see us cutting rates this year.” This, by the Fed, despite what the bond market is saying: the interest rate hiking cycle is done and cuts are coming. If we assume that the bond market doesn’t lie, I believe the hiking cycle should end but no cuts. I now ask, “Will the bond market eventually readjust its expectations, or will the Fed?” More pounding in my head.
If you want another copy of the chart I have featured a few times depicting the relationship between the 2-Year U.S. Treasury Yield and the Fed Funds Rate, which was coupled with the chart titled “The Bond Market Never Lies,” please let me know.
What has also led to certain Wall Street participants feeling pain (“Can you show me where it hurts”), and/or simply remain comfortably numb?
- Banking sector: Wall Street tries to assess the extent of the banking crisis and how it will play out going forward. More specifically, the Regional Bank Index attempts to stabilize and rebuild a new, longer underlying base of support. This is important because it helps identify buyers, sellers, and a stop-loss point if the lower end of the base is violated. It also counsels patience and discipline (risk management) when trying to assess the backdrop. Figure 1. Speaking to the banking backdrop, Ed Yardeni recently stated, “More important than any economic indicators this week will be whether there is more bad news indicating that the banking crisis is far from over. No news would be good news. That’s what we’re rooting for.”
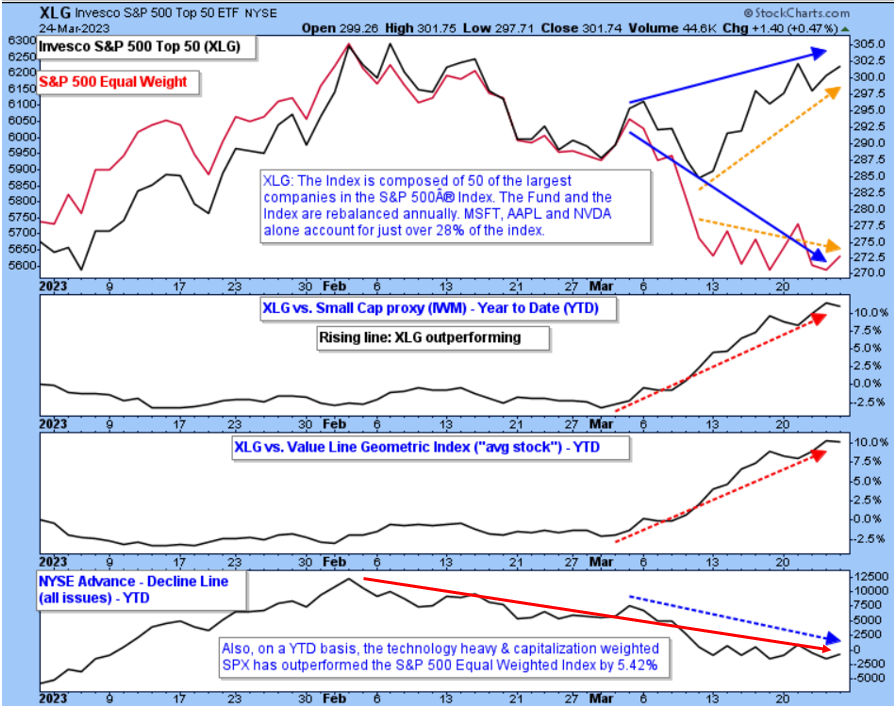
- Deteriorating breadth: The S&P 500 is higher today than when the bank crisis commenced, but the broad market is not participating to the same degree. Facts, not headlines: Fewer stocks are participating on the upside, and this must change. Figure 2.
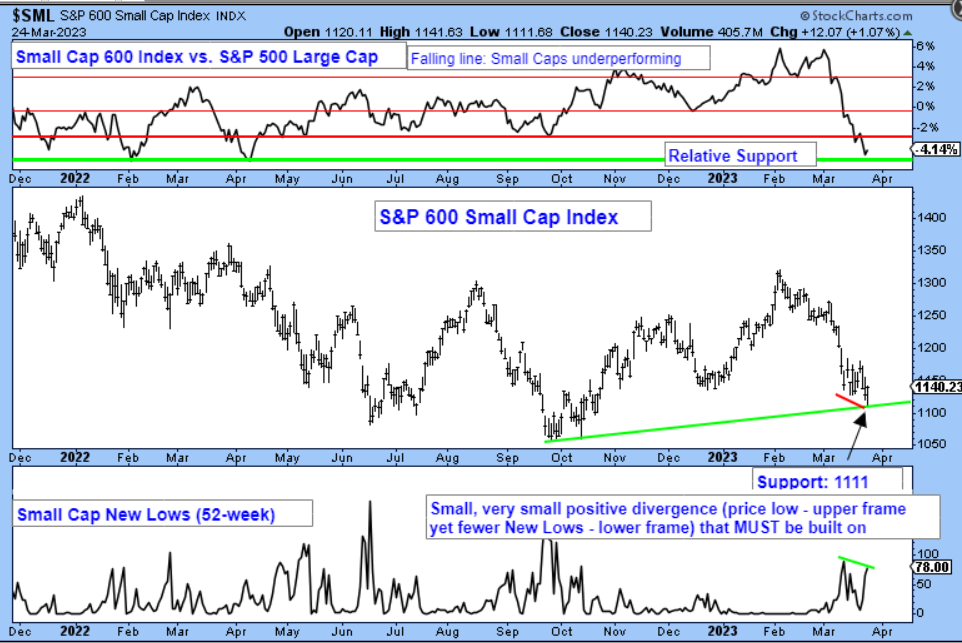
- Small Caps: Absolute and relative tape action has been abysmal. However, a small positive divergence occurred last week, which must lead to further upside follow-through. Figure 4.
Figure 1: Dow Jones U.S. Select Regional bank Index. | Is the index deeply oversold? Yes. However, considering potential “aftershocks,” should we simply be patient and take a wait-and-see attitude as a base develops? While you must decide what fits best given your objectives and tolerance for risk, I think it would be prudent to do so—also, please see verbiage below chart.
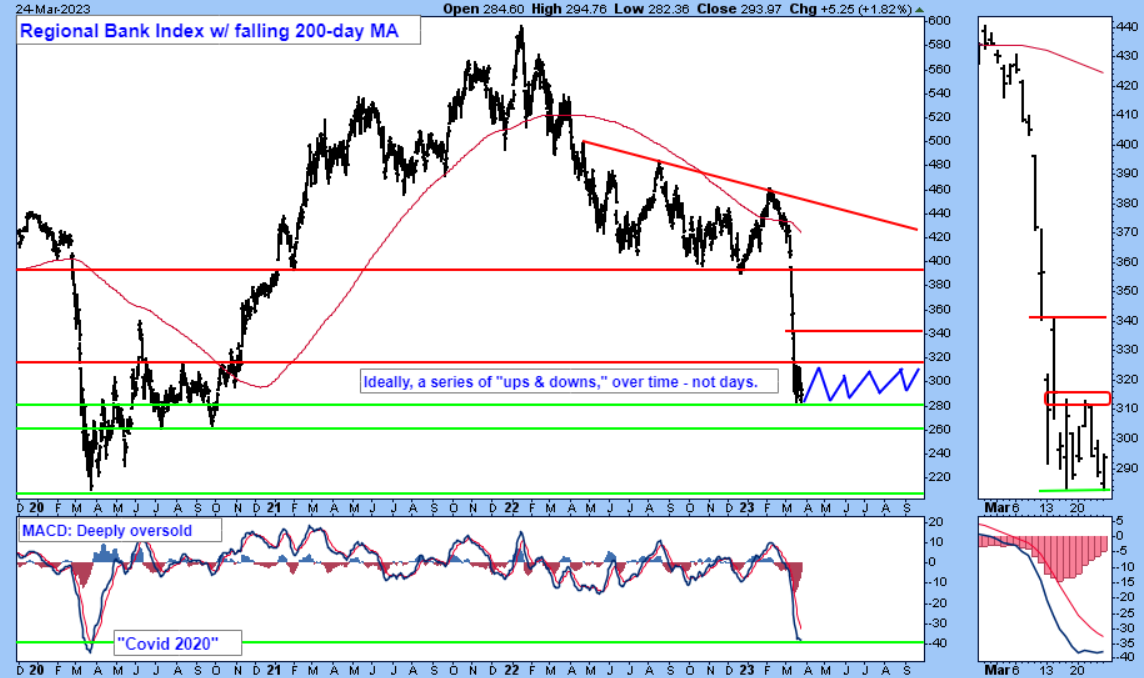
The chart above is how bases should form. There should be a series—not one or two—but an entire series of back-and-forth moves that tell us where the buyers live. It tells us, several times, what price area buyers are willing to step up to the plate. It also tells us where they want to sell the first several times as well. Think of it like the stock fell and broke its arm and maybe its leg, too. From personal experience, healing broken bones is not quick, no matter how impatient we are.
Figure 2: S&P 500 Top 50 ETF (black) and S&P 500 Equal Weighted Index (red). | Due to quarter end positioning, could this narrow leadership continue? Yes. However, whether it does or doesn’t, it isn’t supportive. Unless it is favorably resolved by more stocks participating on the upside it can produce a deeper, negative response by equities. As Todd Sohn recently stated, “it raises concentration risk...”
Burdened by Resistance
Thanks in part to its heavy reliance on large cap technology components, the SPX has been trading sideways since as recently as November 2022 and as far back as May 2022, albeit with some very large swings in both directions—Stuck in the Middle with You. Clearly mega-cap technology has been doing the heavy lifting, with AAPL and MSFT accounting for more than half of the S&P 500’s YTD gain (as of 3/20/23, per CNBC).
Figure 3: S&P 500 with no indicators, just “price.” | Please refer to the verbiage directly above and inside the chart.
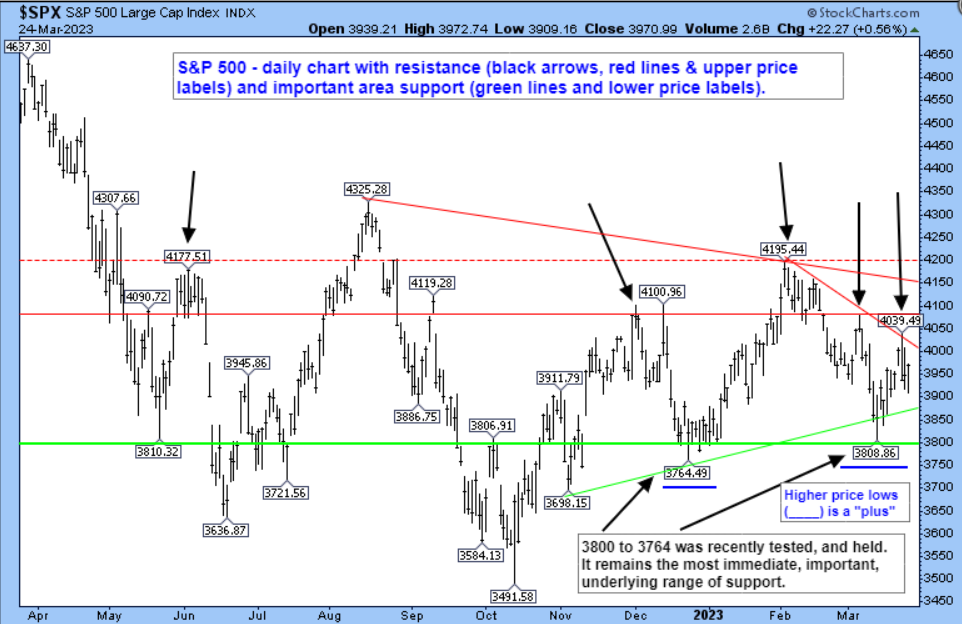
Figure 4: S&P 600 Small Cap Index. |”Small-cap stocks, which are typically domestically focused and smaller in size, tend to be more vulnerable to economic turbulence, often bearing the brunt of market swings. Therefore, small-cap stocks can serve as a useful indicator of the broader market sentiment and economic outlook.” ~Tier1 Alpha. The very small positive divergence from last Monday, 3/24/23 (see below), must be built on.
Meanwhile
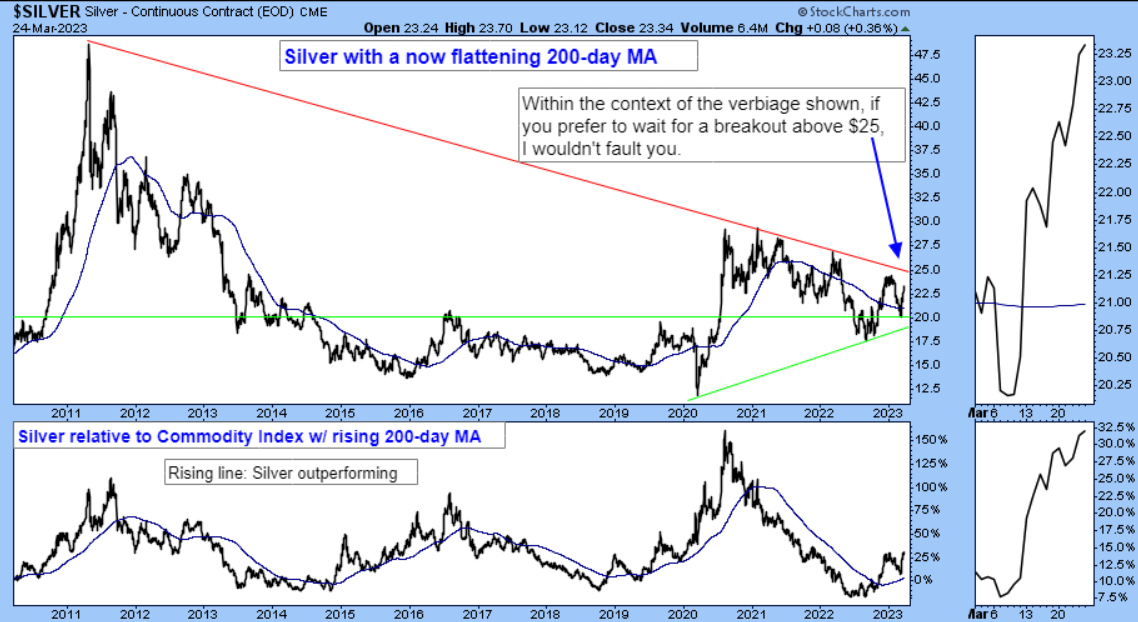
Figure 5: Silver – absolute and relative to Commodity Index (weighed heavily by energy). | Not as a hedge against inflation but only as a hedge against something new breaking (like my recent comments about Gold), “buy, identify a stop-loss point that must be followed, and continually monitor and manage risk in both directions!”
The Day Hagan/Ned Davis Research Smart Sector strategies utilize measures of price, valuation, economic trends, monetary liquidity, and market sentiment to make objective, unemotional, rational decisions about how much capital to place at risk, as well as where to place that capital. Please reach out for specifics.
Day Hagan Asset Management appreciates being part of your business, either through our research efforts or investment strategies. Please let us know how we can further support you.
Art Huprich, CMT®
Chief Market Technician
Day Hagan Asset Management
—Written 3.26.2023. Chart and table source: Stockcharts.com unless otherwise noted.
For more news, information, and analysis, visit the ETF Strategist Channel.
Disclosure
The data and analysis contained herein are provided “as is” and without warranty of any kind, either express or implied. Day Hagan Asset Management (DHAM), any of its affiliates or employees, or any third-party data provider, shall not have any liability for any loss sustained by anyone who has relied on the information contained in any Day Hagan Asset Management literature or marketing materials. All opinions expressed herein are subject to change without notice, and you should always obtain current information and perform due diligence before investing. DHAM accounts that DHAM, or its affiliated companies manage, or their respective shareholders, directors, officers and/or employees, may have long or short positions in the securities discussed herein and may purchase or sell such securities without notice. The securities mentioned in this document may not be eligible for sale in some states or countries, nor be suitable for all types of investors; their value and income they produce may fluctuate and/or be adversely affected by exchange rates, interest rates or other factors.
Investment advisory services offered through Donald L. Hagan, LLC, a SEC registered investment advisory firm. Accounts held at Raymond James and Associates, Inc. (member NYSE, SIPC) and Charles Schwab & Co., Inc. (member FINRA, SIPC). Day Hagan Asset Management is a dba of Donald L. Hagan, LLC.
For more information, please contact us at:
Art Huprich, CMT
[email protected]
For more information, please contact us at:
Day Hagan Asset Management
1000 S. Tamiami Trl
Sarasota, FL 34236
Toll Free: (800) 594-7930
Office Phone: (941) 330-1702
Website: https://dayhagan.com or https://dhfunds.com
