
By Gary Stringer, Kim Escue and Chad Keller, Stringer Asset Management
Global measures of business activity accelerated in January, which supported our view that the global economy would continue to grow over the near-term. Both the JP Morgan Global Composite PMI and the economically weighted U.S. ISM Purchasing Managers Index showed that manufacturing activity rebounded in most large economies as the service sector also continued to grow. While the euro zone, led by a continued slowdown in German manufacturing, was the weakest major economic region, the pace of contraction in the manufacturing sector slowed even there.

However, most of this survey data was compiled prior to the outbreak of the coronavirus and any subsequent government or private sector response. This outbreak is obviously a humanitarian crisis. For economic outlook and investment purposes, we are specifically concerned with economic and market impacts related to this event. While many economies around the world are likely to be negatively impacted by this outbreak, albeit temporarily, the U.S. will likely see little economic impact overall.
China, on the other hand, will be impacted to a far greater degree. For example, China has seen factory shutdowns and travel restrictions that should significantly curtail current economic activity and hurt economic growth with their major trading partners, which are primarily in Asia. Supply chain disruptions are likely to be prevalent. Even German automobile production is likely to be negatively impacted due to their reliance on factories in China.
The U.S. economy is rather insulated and our major trading partners are our close neighbors Canada and Mexico. Furthermore, and as we have mentioned before, of the major economies around the world, no country relies on foreign trade less than the U.S. This can be seen in the following graph showing Organization for Economic Cooperation and Development (OECD) countries ranked by exports as a percentage of GDP.
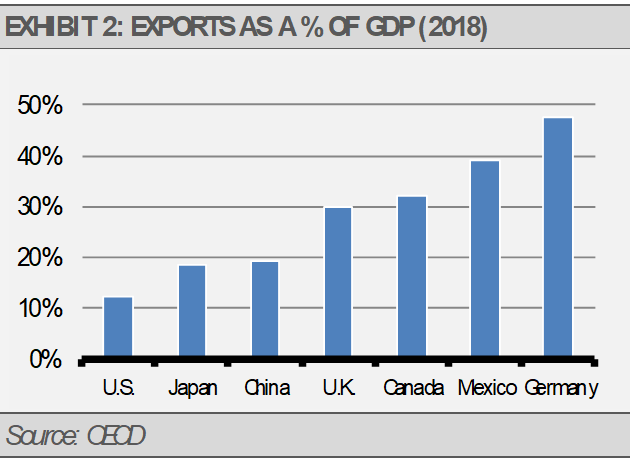
Nearly 90% of U.S. economic activity is domestically oriented, so the resilience of U.S. economic data is particularly important to our current allocation focus on U.S. markets. Encouragingly, surveys suggest that new orders continue to move higher, which tends to lead to more capital investment and earnings growth.
In addition, we are pleased that the U.S. Federal Reserve (Fed) reversed course last year to move from restricting liquidity growth through higher interest rates and reducing the size of their balance sheet to increasing liquidity growth. As the U.S. economy grows, demand for our currency increases. To support stable economic growth, the Fed should ensure that the economy has enough liquidity to support that growth. It is also important to factor in the increasing demand for U.S. dollars abroad as the greenback remains the world’s primary reserve currency.
We can see the impact of the Fed policy shift in the recent increase in liquidity growth, as measured by M1, which includes hard currency and demand deposits, such as checking accounts. Importantly, M1 has reversed the negative trend that we saw in the middle of 2018 (exhibit 3). We view this development as a positive sign for future growth as Fed policy shifts take several months to work their way through the economy. The lagged effect of this policy shift last year can be seen in economic growth today and for months to come.
The U.S. equity market has been resilient to shocks so far, but the U.S. may be vulnerable at our current valuations. The S&P 500 Index has priced in a lot of good news, in our opinion. As exhibit 4 shows, equity prices are pushing the upper bound of historical valuations based on price to earnings multiples.

Our strategies are generally overweight equity sectors that we think still offer attractive relative valuations. These overweights include U.S. health care and information technology with a focus on semiconductors. We are also invested in areas that should be more resilient to a global economic shock, such as global infrastructure. Meanwhile, our fixed income allocations continue to be focused on high quality corporate bonds, mortgage-backed securities, and taxable municipal bonds. In the alternative investments space, we continue to favor a broad allocation to income producing assets including preferreds and REITs, among other assets.
Overall, U.S. economic fundamentals remain strong. With this as a backdrop, we view equity market declines as an opportunity to add to high quality equity positions at more attractive valuations.
THE CASH INDICATOR
Similar to stretched valuations, the recent decline in the level of the Cash Indicator (CI) suggests that the markets may be overly complacent. With the historical median level near 28, the current CI reading at 20 is getting closer to the lower range where we become more concerned about headline risk. Still, at these levels, the CI suggests that markets continue to function within historical norms.

This article was written by Gary Stringer, CIO, Kim Escue, Senior Portfolio Manager, and Chad Keller, COO and CCO at Stringer Asset Management, a participant in the ETF Strategist Channel.
DISCLOSURES
Any forecasts, figures, opinions or investment techniques and strategies explained are Stringer Asset Management LLC’s as of the date of publication. They are considered to be accurate at the time of writing, but no warranty of accuracy is given and no liability in respect to error or omission is accepted. They are subject to change without reference or notification. The views contained herein are not be taken as an advice or a recommendation to buy or sell any investment and the material should not be relied upon as containing sufficient information to support an investment decision. It should be noted that the value of investments and the income from them may fluctuate in accordance with market conditions and taxation agreements and investors may not get back the full amount invested. Past performance and yield may not be a reliable guide to future performance. Current performance may be higher or lower than the performance quoted.
The securities and strategies identified and described may not represent all of the securities purchased, sold or recommended for client accounts. The reader should not assume that an investment in the securities identified was or will be profitable.
Data is provided by various sources and prepared by Stringer Asset Management LLC and has not been verified or audited by an independent accountant.
Index Definitions:
S&P 500 Index – This Index is a capitalization-weighted index of 500 stocks. The Index is designed to measure performance of a broad domestic economy through changes in the aggregate market value of 500 stocks representing all major industries.
