
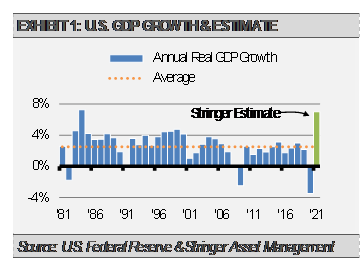
Our outlook for the U.S. economy has improved. We now expect real GDP growth over the course of 2021 to be close to 7%, which would be the fastest annual growth rate since 1984.
Monetary conditions in the U.S. continue to look strong as do measures of fundamental economic health, such as purchasing manager indices (PMIs). The following graph shows the three-month moving average PMI minus the 12-month moving average PMI. When the 12-month is higher than the three-month, the pace of economic growth is expected to be slowing. Conversely, when the three-month is higher than the 12-month, as is the case today, we expect the pace of economic growth to be accelerating.

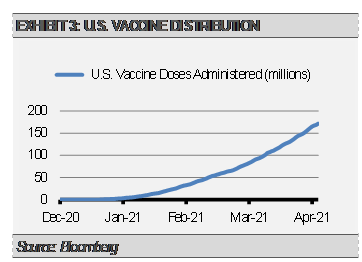
The economy is building momentum as it reopens with broader vaccine distribution as a key driver. According to recent Bloomberg estimates, with U.S. citizens getting roughly 3,000,000 vaccine doses per day on average, we should reach herd immunity in approximately three months.
We expect jobs creation to accelerate in the coming months as businesses improve and the economy reopens. Employment in the worst hit areas, such as leisure and hospitality, should rebound strongly. Though the leisure and hospitality sector makes up only 9% of U.S. employment, the industry accounts for nearly 40% of the remaining job losses since last year. We expect strong jobs numbers in the near-term to narrow this gap. According to the Bureau of Labor Statistics, the U.S. economy created 1.617 million jobs in Q1 2021, which was primarily led by 647,000 in the leisure and hospitality sector.
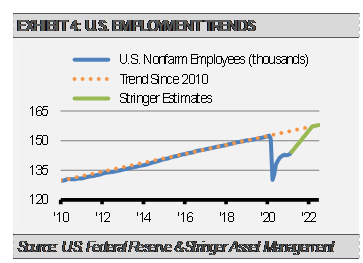
Still, there is plenty of remaining slack in the labor market. During the previous business cycle, the U.S. economy created an average of 188,000 new jobs per month. At the precrisis peak, our economy employed approximately 9.5 million more workers than were shown in the latest employment report. Given the strength that we see in economic trends and vaccine distribution, we expect to see this roughly 9.5 million jobs gap close by this time next year, and possibly even sooner. Additionally, we expect the economy to continue jobs growth at the precrisis trend through the summer of 2022 and perhaps beyond.
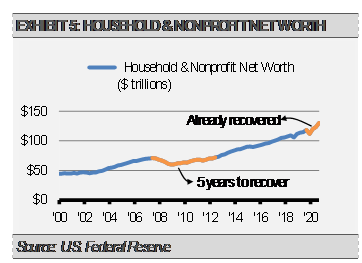
More jobs creation will likely add to the already healthy consumer sector as household incomes, balance sheets, and net worth are at very strong levels already. Similar to the 2009 economic turning point, we are seeing the convergence of both fiscal and monetary stimulus. The current stimulus is much larger than the response to the Global Financial Crisis (GFC) and the recovery is happening much faster. Unlike the GFC, the COVID-19 pandemic did not induce a balance sheet recession. During the GFC recovery, household and business spending and investment was limited as increased cashflows were dedicated to balance sheet repair. In the current case, both corporate and household balance sheets are strong and getting stronger due to the economic recovery and increased hiring, in addition to more fiscal stimulus. As the following graph illustrates, it took households and non-profit organizations five years to surpass the Q3 2007 net worth high of $70.9 trillion. Contrast that to the current recovery where household and non-profit Q4 2019 net worth of $118.2 trillion was already surpassed as of Q2 2020 and most recently stands at $130.2 trillion as of Q4 2020.
We are seeing similar trends in for-profit organizations as well. As a result, we expect a much faster return to precrisis economic and jobs growth rates than we saw after the Global Financial Crisis.
INVESTMENT IMPLICATIONS
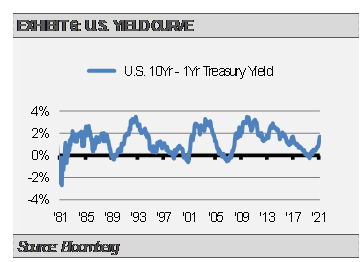
This all adds up to a speedy economic recovery in our view, which has implications for inflation, bond prices, and stock prices. After a near-term spike in inflationary measures due to base effects (i.e., going from deflation a year ago to reopening economic inflation), longer-term inflationary conditions should build over the coming months. We expect improved real economic growth combined with higher inflation expectations to push long-term interest rates higher in fits and starts. As exhibit 6 shows, the difference between long-term and short-term interest rates increases to about 3% during an economic recovery. Given today’s interest rate environment, that equates to the 10-year Treasury yield moving closer to 3% over the next 12 to 18 months.
Based on historical patterns and where we think we are in the economic recovery, we think that cyclical value sectors and the value style overall, as well as quality/defensive sectors like health care will outperform. In fact, we think that we are only about halfway through the period of the value style outperforming growth.
On the fixed income side, our Strategies are underweight interest rate sensitivity and U.S. Treasuries in favor of shorter-duration asset-backed and mortgage-backed securities along with Treasury Inflation Protected Securities (TIPS) and bank loans.
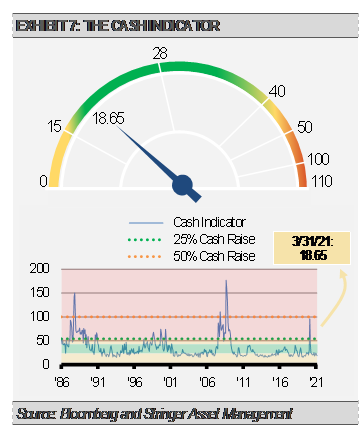
THE CASH INDICATOR
The Cash Indicator (CI) has been useful for helping us judge potential volatility. The CI level remains constructive and reflects that markets are operating in normal ranges of volatility and correlation.
DISCLOSURES
Any forecasts, figures, opinions or investment techniques and strategies explained are Stringer Asset Management, LLC’s as of the date of publication. They are considered to be accurate at the time of writing, but no warranty of accuracy is given and no liability in respect to error or omission is accepted. They are subject to change without reference or notification. The views contained herein are not to be taken as advice or a recommendation to buy or sell any investment and the material should not be relied upon as containing sufficient information to support an investment decision. It should be noted that the value of investments and the income from them may fluctuate in accordance with market conditions and taxation agreements and investors may not get back the full amount invested.
Past performance and yield may not be a reliable guide to future performance. Current performance may be higher or lower than the performance quoted.
The securities identified and described may not represent all of the securities purchased, sold or recommended for client accounts. The reader should not assume that an investment in the securities identified was or will be profitable.
Data is provided by various sources and prepared by Stringer Asset Management, LLC and has not been verified or audited by an independent accountant.
