
Renowned investor Charlie Munger recently suggested today’s speculative market was luring inexperienced individual investors into short-term trading that would ultimately harm their wealth. Mr. Munger has successfully invested through many cycles and his opinions deserve investors’ respect and attention. Instead, his comments were derided as those made by an old guy who does not understand today’s more modern markets.
Everyone should cringe at such ageism not only because it reflects a general underappreciation of the risks associated with investing, but also because history has repeatedly shown short-term trading, especially in popular momentum stocks, does indeed often destroy wealth.
Building wealth is actually a slow process. The keys to truly building wealth, as Mr. Munger knows and this Baby Boomer lives by, generally center on a patient approach to investing in out-of-favor companies or asset classes.
Patience can be an effective risk reduction tool
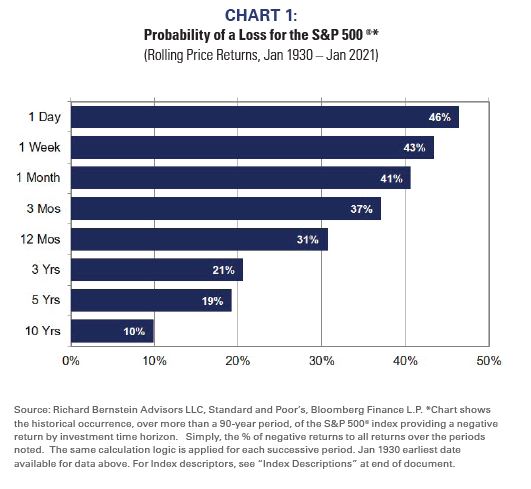
Empirical data show the probability of success when day trading is only slightly better to that when flipping a coin. There has historically been about a 54/46 chance of making money when holding stocks for a day versus 50/50 resulting from coin flipping. (See Chart 1).
However, the probability of losing money has historically decreased as one extended their investment time horizon. Even extending one’s time horizon from one day to one year decreased the probability of a negative return by 15 percentage points (from 46% to 31%), and extending time horizon by years meaningfully reduced risk. Holding stocks, here represented by the S&P 500®, for 10 years has historically resulted in a positive return about 90% of the time. Most people will agree that 90/10 are superior odds to 54/46.
Importantly, this analysis is based on pre-tax returns and does not include reinvesting dividends. Including taxes and dividends in the analysis would have further decreased the attractiveness of short- term trading.
Short-term trading usually results in lower after-tax returns because short-term returns are generally taxed as income, whereas longer-time horizon returns often qualify for lower capital gains tax rates. The compounding of dividends significantly boosts long- term returns, whereas short-term traders often don’t even receive dividends. So short-term trading can result in higher tax bills and omitting dividend income.
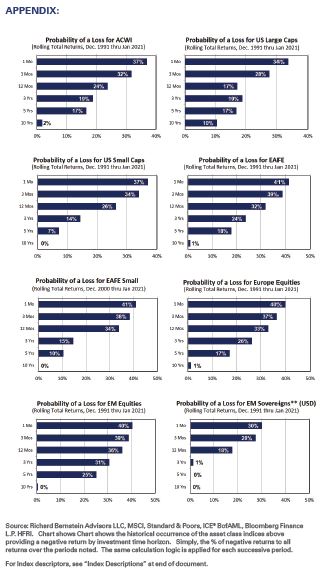
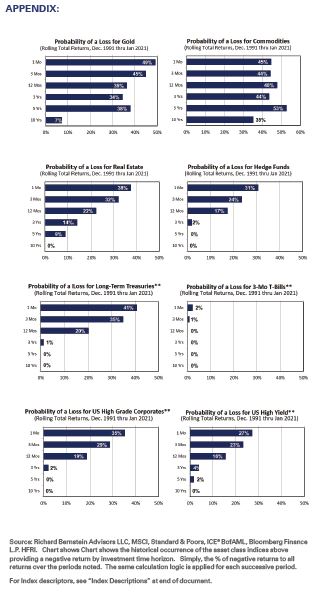
The appendix shows similar charts for many asset classes. Except when investing in gold or commodities, time appears to be an effective risk reduction tool.
“Bad” companies make good stocks
I always suggest younger investors with extremely long time horizons (i.e., in an IRA or 401(k)) buy and hold a well-diversified portfolio of low-quality companies. This runs counter to the generally accepted strategy of buying high quality companies, but history shows well that “bad”1 companies tend to make good stocks over longer time horizons.
Chart 2 might help explain my preference for long-term oriented investing in lower quality stocks. The chart shows one-year risk/return combinations for various asset subsets. Categories higher in the chart have historically provided better returns, and those further to the right have more frequently had negative one-year returns.
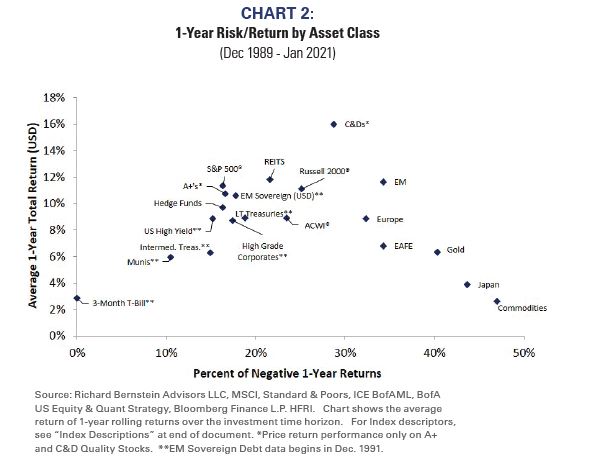
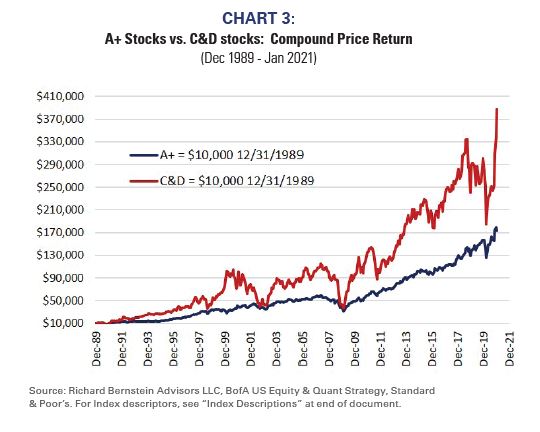
Note that C&D stocks (based on S&P Common Stock Rankings) have historically provided the best returns and are the furthest “north” in the chart. Their average 1-year return was about 16% versus roughly 12% for A+ ranked stocks. If a 25-year old bought and held $10,000 of low quality stocks at the end of 1989, their nest egg today at age 57 would be worth about $387,000 versus only about $173,000 if they had bought A+ stocks, i.e., more than double the compounded return (see Chart 3).
The famous Ibbotson-Sinquefield study based on data beginning in the 1920s (Ibbotson & Sinqefield Stocks, Bonds, Bills and Inflation the Past and the Future: 1982 Ed. 1982) showed similar results. Their study highlighted a universe of fallen-angel small stocks (i.e. companies that were previously larger but fell to the 9th and 10th deciles of size) outperformed other asset classes through time.
Chart 2 highlights again patience is an investment virtue. Although C&D stocks have historically provided superior returns, they have also experienced significant volatility, i.e., almost twice that of A+ stocks. Riding the low-quality roller coaster has historically provided higher returns, but the challenge was having the patience and fortitude to remain strapped in and riding.
Isn’t technology changing the world?
Investors often forget they are investing in companies and not investing in stories. Whereas an investment story can often sound particularly attractive, one should never overlook the valuation of
a company’s assets associated with a story. A story might come true, but that doesn’t mean the stocks associated with the story will outperform.
For example, there were many stories during the Technology Bubble regarding technology and communications changing peoples’ lives, and investors believed technology and communication stocks were uniquely attractive because of those stories. It was ironic that most of the over-hyped stories came true during the decade after the Tech Bubble, but the Technology and Communications sectors were the worst performing sectors (See Chart 4). The stocks were so overvalued the stock prices fell despite technology significantly changing the economy. Investors learned the hard way to pay attention to fundamentals.

What’s the difference between the stock market and a horse race?
Many investors think of the stock market as a horse race, gambling, or gaming. Individuals often use the term “bet” when placing trades (i.e., I made a bet on company XYZ.). The increased use of options by individual investors seems to reflect a desire to place over/under bets on stocks. Some trading apps play fanfares when traders place trades or take gains.
These individuals clearly don’t understand one becomes a partial owner of a company when one buys a company’s shares. The success of investing isn’t some magical “it went up”, but rather the appreciation of the value of a company as the company’s sales and earnings grow.
So, the stock market isn’t similar to betting on a horse in a race. Rather, it’s like buying a horse, training it, entering it into races, racing successfully, and putting the horse out to stud. The value of the horse is determined largely by the value of the prizes won and the potential subsequent breeding fees. Equity investing is not a wager in the 7th race at Belmont.
Become your parents
We’ve all likely seen the insurance commercials about the pitfalls of becoming your parents. For the record, I do know how to pronounce quinoa and how to open a PDF and I do not recommend grout brushes to strangers.
However, it might pay to become your parents when it comes to investing. The experiences of multiple cycles can sometimes prove invaluable. The old telephone pitches have been replaced by today’s chat rooms, but building wealth still isn’t about joining a herd of investors rushing to the “new new thing.” It’s about patience and buying out-of-favor and undervalued assets.
Sometimes, Boomer really does know best.
Don’t miss out on future RBA Insights, subscribe today.
To learn more about RBA’s disciplined approach to macro investing, please contact your local RBA representative.
INDEX DESCRIPTIONS:
The following descriptions, while believed to be accurate, are in some cases abbreviated versions of more detailed or comprehensive definitions available from the sponsors or originators of the respective indices. Anyone interested in such further details is free to consult each such sponsor’s or originator’s website.
The past performance of an index is not a guarantee of future results.
Each index reflects an unmanaged universe of securities without any deduction for advisory fees or other expenses that would reduce actual returns, as well as the reinvestment of all income and dividends. An actual investment in the securities included in the index would require an investor to incur transaction costs, which would lower the performance results. Indices are not actively managed and investors cannot invest directly in the indices.
ACWI: MSCI All Country World Index (ACWI®): The MSCI ACWI® Index is a widely recognized, free-float-adjusted, market- capitalization-weighted index designed to measure the equity- market performance of global developed and emerging markets.
S&P 500®: Standard & Poor’s (S&P) 500® Index: The S&P 500® Index is an unmanaged, capitalization-weighted index designed to measure the performance of the broad US economy through changes in the aggregate market value of 500 stocks representing all major industries.
EAFE: MSCI EAFE Index. The MSCI EAFE Index is a free- float-adjusted, market-capitalization-weighted index designed to measure the equity-market performance of
Europe: MSCI Europe Index. The MSCI Europe Index is a free- float-adjusted, market-capitalization-weighted index designed to measure the equity-market performance of the developed markets in Europe. The MSCI Europe Index consists of the following 16 developed market country indices: Austria, Belgium, Denmark, Finland, France, Germany, Greece, Ireland, Italy, the Netherlands, Norway, Portugal, Spain, Sweden, Switzerland, and the United Kingdom
EM: MSCI Emerging Markets (EM) Index. The MSCI EM Index is a free-float-adjusted, market-capitalization-weighted index designed to measure the equity-market performance of emerging markets.
Japan: MSCI Japan Index. The MSCI Japan Index is a free- float-adjusted, market-capitalization-weighted index designed to measure the equity-market performance of Japan.
Small Caps: Russell 2000 Index. The Russell 2000 Index is an unmanaged, capitalization-weighted index designed to measure the performance of the small-cap segment of the US equity universe. The Russell 2000 Index is a subset of the Russell 3000® Index.
Gold: Gold Spot USD/oz Bloomberg GOLDS Commodity. The Gold Spot price is quoted as US Dollars per Troy Ounce.
Commodities: S&P GSCI® Index. The S&P GSCI® seeks to provide investors with a reliable and publicly available benchmark for investment performance in the commodity markets, and is designed to be a “tradable” index. The index is calculated primarily on a world production-weighted basis and is comprised of the principal physical commodities that are the subject of active, liquid futures markets.
REITS: THE FTSE NAREIT Composite Index. The FTSE NAREIT Composite Index is a free-float-adjusted, market- capitalization-weighted index that includes all tax qualified REITs listed in the NYSE, AMEX, and NASDAQ National Market.
Hedge Fund Index: HFRI Fund Weighted Composite Index. The HFRI Fund Weighted Composite Index is a global, equal-weighted index of over 2,000 single-manager funds that report to the HFR (Hedge Fund Research) database. Constituent funds report monthly net-of-all-fees performance in USD and have a minimum of $50 million under management or a twelve (12)-month track record of active performance. The Index includes both domestic (US) and offshore funds, and does not include any funds of funds.
A+s: The BofA Quality indices are designed as a monthly grouping of the stocks in the BofA US research coverage universe based on their Standard and Poor’s quality ranking. The returns shown are calculated based on the subsequent months’ average price return of each group assuming monthly rebalancing. The A+ group represents the highest quality group.
C&D’s: The BofA Quality indices are designed as a monthly grouping of the stocks in the BofA US research coverage universe based on their Standard and Poor’s quality ranking. The returns shown are calculated based on the subsequent months’ average price return of each group assuming monthly rebalancing. The C&D group represents the lowest quality group.
About Richard Bernstein Advisors
Richard Bernstein Advisors LLC is an investment manager focusing on long-only, global equity and asset allocation investment strategies. RBA runs ETF asset allocation SMA portfolios at leading wirehouses, independent broker/dealers, TAMPS and on select RIA platforms.
Additionally, RBA partners with several firms including Eaton Vance Corporation and First Trust Portfolios LP, and currently has $12.0 billion collectively under management and advisement as of January 31st, 2021. RBA acts as sub‐advisor for the Eaton Vance Richard Bernstein Equity Strategy Fund, the Eaton Vance Richard Bernstein All‐Asset Strategy Fund and also offers income and unique theme‐oriented unit trusts through First Trust. RBA is also the index provider for the First Trust RBA American Industrial Renaissance® ETF. RBA’s investment insights as well as further information about the firm and products can be found at www.RBAdvisors.com.
Nothing contained herein constitutes tax, legal, insurance or investment advice, or the recommendation of or an offer to sell, or the solicitation of an offer to buy or invest in any investment product, vehicle, service or instrument. Such an offer or solicitation may only be made by delivery to a prospective investor of formal offering materials, including subscription or account documents or forms, which include detailed discussions of the terms of the respective product, vehicle, service or instrument, including the principal risk factors that might impact such a purchase or investment, and which should be reviewed carefully by any such investor before making the decision to invest. RBA information may include statements concerning financial market trends and/or individual stocks, and are based on current market conditions, which will fluctuate and may be superseded by subsequent market events or for other reasons. Historic market trends are not reliable indicators of actual future market behavior or future performance of any particular investment which may differ materially,
and should not be relied upon as such. The investment strategy and broad themes discussed herein may be inappropriate for investors depending on their specific investment objectives and financial situation. Information contained in the material has been obtained from sources believed to be reliable, but not guaranteed. You should note that the materials are provided “as is” without any express or implied warranties. Past performance is not a guarantee of future results. All investments involve a degree of risk, including the risk of loss. No part of RBA’s materials may be reproduced in any form, or referred to in any other publication, without express written permission from RBA. Links to appearances and articles by Richard Bernstein, whether in the press, on television or otherwise, are provided for informational purposes only and in no way should be considered a recommendation of any particular investment product, vehicle, service or instrument or the rendering of investment advice, which must always be evaluated by a prospective investor in consultation with his or her own financial adviser and in light of his or her own circumstances,
including the investor’s investment horizon, appetite for risk, and ability to withstand a potential loss
of some or all of an investment’s value. Investing is subject to market risks. Investors acknowledge and accept the potential loss of some or all of an investment’s value. Views represented are subject to change at the sole discretion of Richard Bernstein Advisors LLC. Richard Bernstein Advisors LLC does not undertake to advise you of any changes in the views expressed herein.
© Copyright 2021 Richard Bernstein Advisors LLC. All rights reserved. PAST PERFORMANCE IS NO GUARANTEE OF FUTURE RESULTS
