
By Denis Rezendes, CFA
“What happened to fixed income ETFs in the March sell-off?”
So far, we’ve kept quiet on the subject. Not due to a lack of opinions, but because we felt we didn’t have much to add to the discussion. Our many fund sponsor and trading partners (SSGA, iShares, Invesco, and Jane Street to name a few) have done a fantastic job of providing detailed analyses on the subject. Anything we could have produced over the past month would have been nothing more than a regurgitation of work produced by others. So, what’s changed? Why have we decided, after the fact, to throw our hat in the ring? Because we finally feel like we have something unique to offer.
Over the past month we’ve listened to countless webinars, read every research report available, and had direct conversations with many fund sponsors and trading firms. As a firm with over $2 billion in ETF assets, we felt it was necessary to critically evaluate the performance of these securities during the COVID-19 induced crisis that unfolded in the first quarter of 2020. Hopefully we can provide insight into the questions that we’re asking, how we’ve approached these questions, and the answers we’ve received. Although our research is ongoing, we feel we’ve reached a point where we can walk our clients through the research we’ve conducted to date.
The question at the heart of the matter is, “Why did fixed income ETFs diverge from their Net Asset Values (NAVs) in March?” First, we want to stress that this is a pricing question, not a liquidity one. The iShares 20+ Year Treasury Bond ETF (TLT), Investment Grade Corporate Bond ETF (LQD), and High Yield Corporate Bond ETF (HYG) all set records for daily trading volume—12.7, 5.5, and 8.5 billion Dollars respectively—in late-February and early-March. During this time period ETFs were some of the most liquid fixed income securities available on the market[1]. The question for investors is not whether they would be able to transact at the market price, but whether that market price was an accurate reflection of the ETF’s underlying securities.
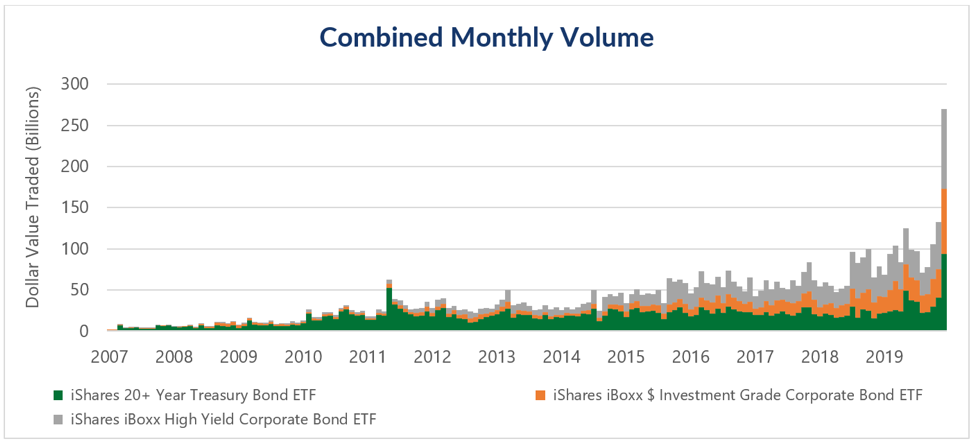
Source: Bloomberg, Beaumont Capital Management (BCM). Data for the period 4/1/2007 through 3/31/2020.
To analyze a discount to NAV, we first need to understand what it is and how it’s calculated. A NAV is intended to represent the value of all the securities in an ETF divided by the total number of ETF shares outstanding. The genius of the ETF wrapper is its built-in arbitrage mechanism. If an ETF is trading at a true—emphasis on true—discount to NAV, an institutional investor can buy the ETF, exchange the ETF for the underlying securities and sell those securities for a risk-free profit. This arbitrage mechanism generally prevents ETFs from drifting too far from their NAV, but only if institutional investors think that they can realize the prices that make up the NAV.
In a perfect world, the NAV would reflect a price for each underlying security at which there are willing buyers and sellers in the market. Equity ETFs come close to achieving this as most, if not all, of the underlying securities are actively traded, but fixed income ETFs must deal with the fact that many of their underlying securities trade infrequently. If there are no recent trades to determine what price a willing buyer and seller agree to, how do bonds get priced each day? They are estimated by bond pricing services such as IHS Markit. Fixed income ETFs use these price estimates to calculate NAV. On any day in March, would you have bought or sold a stock using an estimated price?
These estimates may be the best way of calculating NAV given the circumstances, but they fall far short of perfection. If you’d like a more detailed look at bond pricing as it relates to ETFs we recommend “Bond ETFs: Not Mispricing (That Would Be The Mutual Funds)” by Dave Nadig, Chief Investment Officer and Director of Research of ETF Trends and ETF Database. Dave provides “painfully specific” examples of individual bonds that trade anywhere from once or twice a day to tens of times each day. In the corporate bond world this is considered highly liquid.
If we can’t trust the accuracy of the NAV, how do we determine whether the ETF’s price was right or wrong? This brings us back to the arbitrage mechanism we described earlier. If the ETF’s price was lower than the value of its assets, we’d expect to see redemptions from the ETF and increased trading in the underlying securities. Instead, trading volume in the underlying securities, due to creation and redemption activity, remained a fraction of the trading volume in the ETFs themselves during the two weeks in March when the ETFs were trading at steep discounts to NAV. If institutional investors thought that the ETF was trading at a material discount to the value of its underlying bonds, they surely didn’t act that way. As evidenced by the graph below, investors bought and sold billions of dollars of fixed income ETFs at the price available in the market without any anomalous creation or redemption activity materializing in the primary market—there was seemingly no arbitrage opportunity available.
[1] Blackrock, the parent company of iShares, noted in their first quarter earnings conference call that “on March 12th, an especially volatile day, the iShares investment-grade bond ETF, LQD, traded almost 90,000 times, while its top five holdings traded an average of 37 times.”
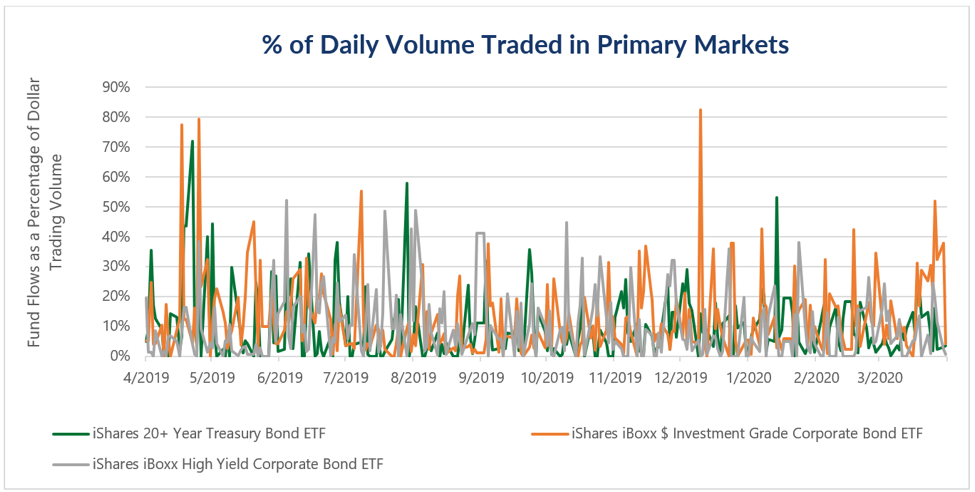
Source: Bloomberg, Beaumont Capital Management (BCM). Data for the period 4/1/2019 through 3/31/2019.
For a slightly more technical discussion, we recommend “The recent distress in corporate bond markets: cues from ETFs” from the Bank of International Settlements (BIS). In summary, the authors stated:
“Pronounced market stress in mid-March highlighted differences in how quickly ETF prices and NAVs incorporate information. Unlike mutual funds, whose assets are valued once a day, ETFs trade continuously, and their liquidity is supported by a variety of intermediaries. As a result, ETFs incorporate information in a more timely manner than the underlying bonds.”
We couldn’t have said it better ourselves. ETFs played a crucial role in providing liquidity and price discovery to fixed income markets during a period of unprecedented market stress and we believe the market price of these ETFs was a better reflection of the market reality than their NAV.
As a quantitative manager, this is particularly important to us because an accurate representation of the market price, even though we may not like the price the market is offering at times, is necessary to provide meaningful signals to our models. We remain confident in the efficacy of ETFs and hope that we’ve presented a compelling summary of our research efforts to date.
This article was contributed by Denis Rezendes, CFA, Assistant Portfolio Manager at Beaumont Capital Management, a participant in the ETF Strategist Channel.
For more insights like these, visit BCM’s blog at blog.investbcm.com.
Disclosures:
Copyright © 2020 Beaumont Capital Management (BCM). All rights reserved.
The views and opinions expressed throughout this presentation are those of the author as of April 30th, 2020. The opinions and outlooks may change over time with changing market conditions or other relevant variables.
This material is provided for informational purposes only and does not in any sense constitute a solicitation or offer for the purchase or sale of a specific security or other investment options, nor does it constitute investment advice for any person. Any reference to specific securities or investments is for illustrative purposes only and is not intended as investment advice nor a recommendation to take any action. Individual securities mentioned may be held in client accounts.
The information presented in this report is based on data obtained from third party sources. Although it is believed to be accurate, no representation or warranty is made as to its accuracy or completeness.
Beaumont Capital Management is not affiliated with, or responsible for, any of the third parties listed above or the content they provided. We believe the 3rd party content to be from reliable sources however we cannot guarantee the accuracy of the information they provide. The view and opinions expressed in the referenced articles are those of the writer and may not be the opinion of Beaumont Capital Management.
As with all investments, there are associated inherent risks including loss of principal. Stock markets, especially foreign markets, are volatile and can decline significantly in response to adverse issuer, political, regulatory, market, or economic developments. Sector and factor investments concentrate in a particular industry or investment attribute, and the investments’ performance could depend heavily on the performance of that industry or attribute and be more volatile than the performance of less concentrated investment options and the market as a whole. Securities of companies with smaller market capitalizations tend to be more volatile and less liquid than larger company stocks. Foreign markets, particularly emerging markets, can be more volatile than U.S. markets due to increased political, regulatory, social or economic uncertainties. Fixed Income investments have exposure to credit, interest rate, market, and inflation risk. Diversification does not ensure a profit or guarantee against a loss.
Past performance is no guarantee of future results.
