
The U.S. economy is experiencing a remarkable period of economic stabilization and growth characterized by resilient personal income and spending, improving business sentiment, and a return to pre-pandemic economic dynamics. This “Great Normalization” reflects the interplay of income growth, relative private sector debt stabilization, and evolving market conditions that signal robust economic potential.
Personal income growth has emerged as a critical driver of economic momentum, and consistently has outpaced inflation as the economy normalizes. This trend is particularly significant because consumer spending represents nearly 70% of U.S. economic activity.
The data suggests that as personal incomes rise, consumers maintain their purchasing power and continue to drive economic expansion. We can see this relationship between income and spending growth in the following graph.
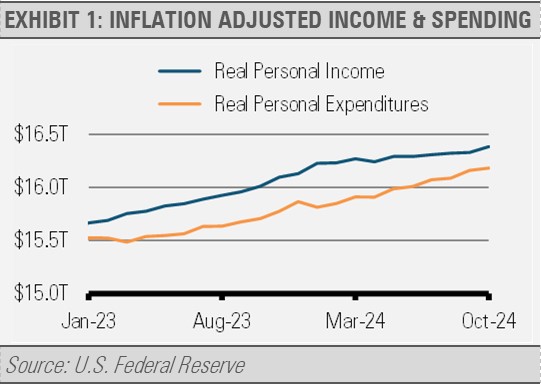
The relationship between income and spending growth demonstrates a symbiotic cycle. As individuals and families earn more, they spend more, which in turn stimulates business revenues and potentially creates additional employment opportunities. This virtuous economic cycle appears sustainable with projections indicating continued strength into 2025.
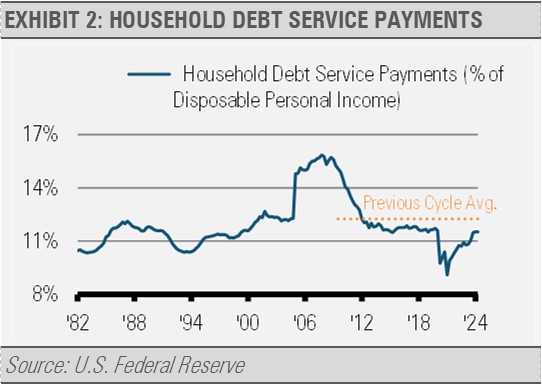
Similarly, overall private sector debt, including both households and businesses, has declined relative to the size of the economy (GDP) to levels consistent with the 2000s and 2010s having fully recovered from the pandemic. Looking at household debt-to-disposable income, we can see how the situation has normalized following the unprecedented economic disruptions of the COVID-19 pandemic. The current household debt-to-income level is at rates similar to the long-term average and well below levels that we saw during the mid-2000s housing boom. This situation represents a fundamental improvement in economic resilience and provides businesses and consumers with greater financial flexibility.
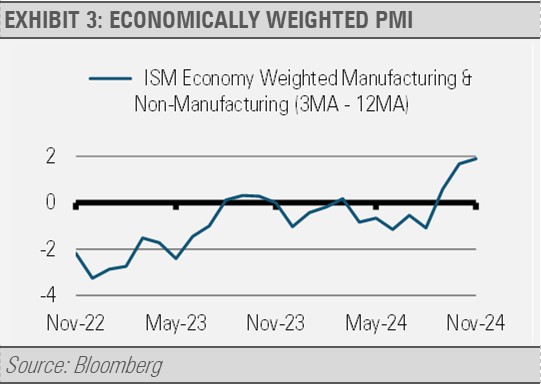
In addition, business surveys, such as Purchasing Manager Indices (PMI), offer compelling evidence for economic optimism. Our economically weighted PMIs have demonstrated significant acceleration in recent months, which reflects growing business activity and confidence across various sectors.
The following graph shows the recent change in the level of our economically weighted PMIs. An increase in the level suggests an uptick in business activity and sentiment, while a decrease indicates the opposite. The recent acceleration is typically predictive of continued business sector expansion and suggests a positive economic trajectory.
INVESTMENT IMPLICATIONS
Despite the encouraging outlook, we remain vigilant about potential risks. Persistent inflation and the possibility of U.S. Federal Reserve policy missteps represent the most significant threats to continued growth in our opinion. Amid this backdrop, we are finding compelling investment opportunities even as equity markets reach new all-time highs. Sectors demonstrating consistent quality earnings growth, such as information technology, insurance, and home building, appear particularly attractive. Within the fixed income markets, high-quality assets in the belly of the yield curve offer the potential for stable returns and a ballast to potential equity market volatility.
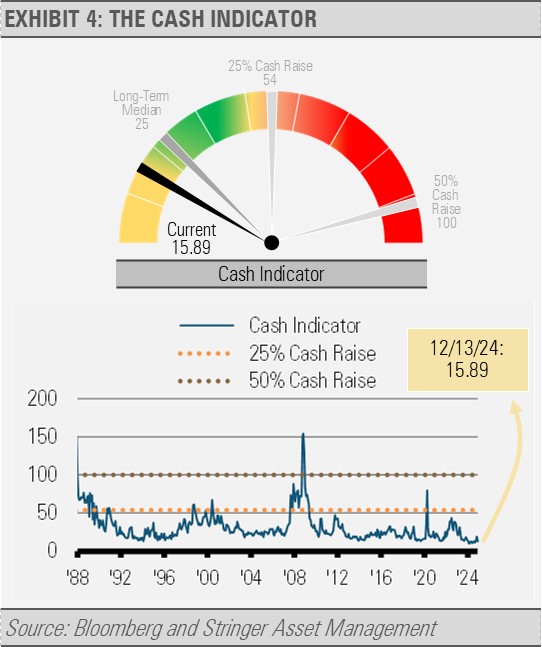
THE CASH INDICATOR
The Cash Indicator (CI) level has declined as the equity market has rallied and fixed income credit spreads remain tight. CI levels this low reflect financial market complacency and potential fragility. Periods of financial market calm like we have seen recently are often followed by bouts of volatility. Despite near-term equity market momentum, we think that investors should expect volatility in the months ahead.
For more news, information, and strategy, visit the ETF Strategist Channel.
DISCLOSURES
Any forecasts, figures, opinions or investment techniques and strategies explained are Stringer Asset Management, LLC’s as of the date of publication. They are considered to be accurate at the time of writing, but no warranty of accuracy is given and no liability in respect to error or omission is accepted. They are subject to change without reference or notification. The views contained herein are not to be taken as advice or a recommendation to buy or sell any investment and the material should not be relied upon as containing sufficient information to support an investment decision. It should be noted that the value of investments and the income from them may fluctuate in accordance with market conditions and taxation agreements and investors may not get back the full amount invested.
Past performance and yield may not be a reliable guide to future performance. Current performance may be higher or lower than the performance quoted.
The securities identified and described may not represent all of the securities purchased, sold or recommended for client accounts. The reader should not assume that an investment in the securities identified was or will be profitable.
Data is provided by various sources and prepared by Stringer Asset Management, LLC and has not been verified or audited by an independent accountant.
