
- May payrolls surprised on the upside, but the economy has a long way to recover.
- Our 6m forecast for the S&P 500 remains negative; and our Short-Term Risk model gave a Sell signal.
- A battle rages between Robinhood investors and professional asset managers.
By Roman Chuyan, CFA
Things looked rosy to bulls in early June as stocks went into a parabolic upswing. The S&P 500 index reached a high point of 3232 on June 8th after the May jobs numbers – the first positive economic report in a while – reinforced the bullish thesis. Then the market interrupted the cheer on Thursday with a 5.8% one-day plunge that erased this month’s gain. Still, the S&P is only 5% below its Dec-31st level – a remarkable feat considering the economic reality.
US and Global Stocks, 1 Year
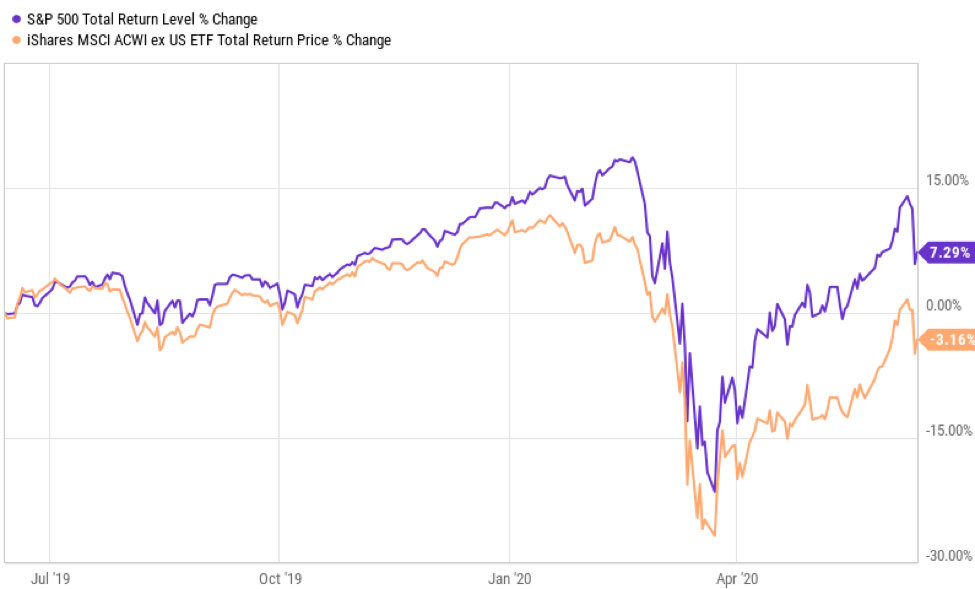
Source: Ycharts, as of 6/12/20. Fund performance is shown for illustration only. Model Capital does not currently hold any of these funds, but positions may change at any time without notice.
Non-farm payrolls for May were exceptionally strong – 2.5 million jobs added, compared with consensus expectations of a 9 million loss. The unemployment rate fell to 13.3% (see chart below) from 14.7% in April, also defying economists’ expectations. In my view, this was as much a testament to the futility of short-term economic projections as to improvement in the job market. Weekly claims for unemployment benefits, although receding, continued at a historically massive level of 1.5 million last week.
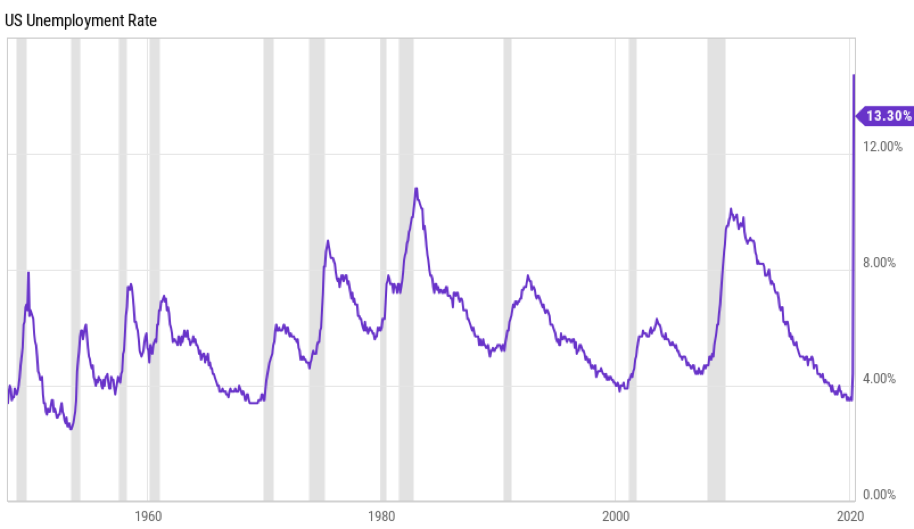
Source: Ycharts
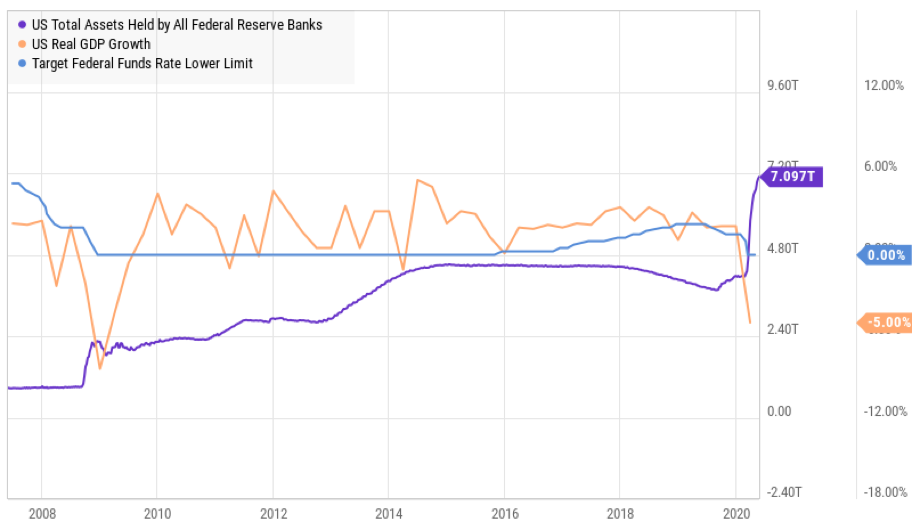
The recent stock market rally is “explained” in financial media by improving future economic and/or earnings outlook. It’s nothing of the sort. No economist was even close to predicting the May jobs, let alone the 2021 economy or earnings. Short-term market moves are a sum-total of investor supply and demand, and it’s becoming clear that a new class of investors has emerged: the “Robinhood investor.” These are newbies who decided to make some extra money off of their stimulus checks. The Fed’s balance sheet increased by $3 trillion this year (see chart below), and Congress authorized over $2 trillion in financial assistance. Apparently, some of this cash infusion was funneled into the stock market – a new source of short-term demand that helped propel stocks up.
So, the battle in on. The professionals have been in retreat, scratching their heads about the disconnect between the market rally and underlying earnings growth, valuation multiples, and general economic numbers. I suspect that none of this matters to Robinhood investors – they care that their stocks “are” (have recently gone) up.
S&P 500 with Selected Technical Indicators, Dec 2019 – May 2020
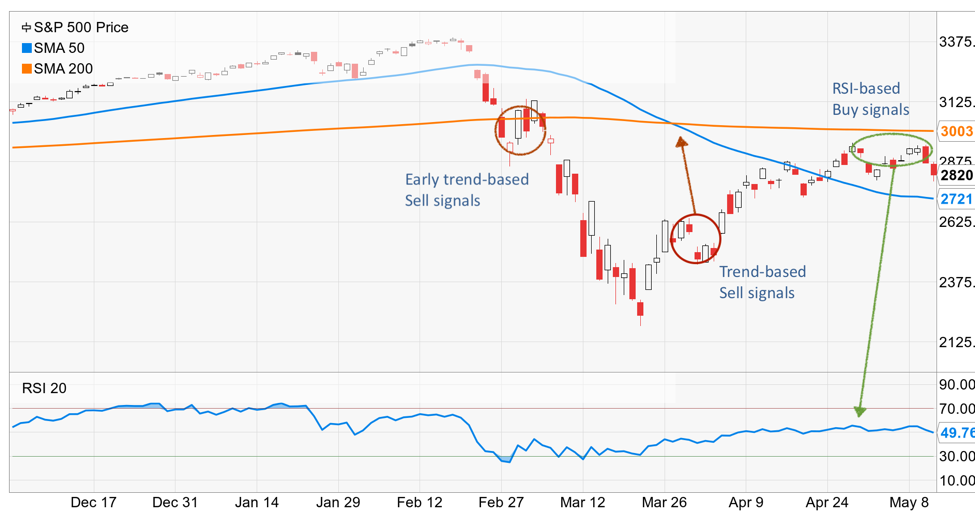
Sources: Ycharts, Model Capital Management LLC
Part of the problem is that some money managers have switched sides in this battle. Managers who follow backward-looking technical indicators such as trends/momentum and relative strength (RSI) jumped into the market recently, increasing demand. As the rally persisted, equity index RSI levels rose (see chart above) and trends turned positive, prompting these programs to buy since mid-May.
But we know that the only certainty in markets is that they’re volatile. I have a sense of who will win this battle. The ranks of the Robinhood army will be dispersed in the next market drop. The outlook for the S&P 500 by our fundamentals-based statistical model continues to be negative, which dictates continued defensive allocation. Consumer Sentiment remains the largest negative factor in the model. In addition, our Short-Term Risk model just gave a Sell signal. This model has worked very well over the past couple of years – most recently, it was very timely in detecting the February-March market downturn. We continue to hold the line in this battle.
About Model Capital Management LLC
Model Capital Management LLC (“MCM”) is an independent SEC-registered investment advisor, and is based in Wellesley, Massachusetts. Utilizing its fundamental, forward-looking approach to asset allocation, MCM provides asset management services that help other advisors implement its dynamic investment strategies designed to reduce significant downside risk. MCM is available to advisors on AssetMark, Envestnet, and other SMA/UMA platforms, but is not affiliated with those firms.
Notices and Disclosures
- This research document, article or newsletter and all of the information contained in it (“MCM Research”) is the property of MCM. The Information set out in this communication is subject to copyright and may not be reproduced or disseminated, in whole or in part, without the express written permission of MCM. The trademarks and service marks contained in this document are the property of their respective owners. Third-party data providers make no warranties or representations relating to the accuracy, completeness, or timeliness of the data they provide and shall not have liability for any damages relating to such data.
- MCM does not provide individually tailored investment advice. MCM Research has been prepared without regard to the circumstances and objectives of those who receive it. MCM recommends that investors independently evaluate particular investments and strategies, and encourages investors to seek the advice of an investment adviser. The appropriateness of an investment or strategy will depend on an investor’s circumstances and objectives. The securities, instruments, or strategies discussed in MCM Research may not be suitable for all investors, and certain investors may not be eligible to purchase or participate in some or all of them. The value of and income from your investments may vary because of changes in securities/instruments prices, market indexes, or other factors. Past performance is not a guarantee of future performance, and not necessarily a guide to future performance. Estimates of future performance are based on assumptions that may not be realized.
- MCM Research is not an offer to buy or sell or the solicitation of an offer to buy or sell any security/instrument or to participate in any particular trading strategy. MCM does not analyze, follow, research or recommend individual companies or their securities. Employees of MCM may have investments in securities/instruments or derivatives of securities/instruments based on broad market indices included in MCM Research.
- MCM is not acting as a municipal advisor and the opinions or views contained in MCM Research are not intended to be, and do not constitute, advice within the meaning of Section 975 of the Dodd-Frank Wall Street Reform and Consumer Protection Act.
- MCM Research is based on public information. MCM makes every effort to use reliable, comprehensive information, but we make no representation that it is accurate or complete. We have no obligation to tell you when opinions or information in MCM Research change.
- MCM DOES NOT MAKE ANY EXPRESS OR IMPLIED WARRANTIES OR REPRESENTATIONS WITH RESPECT TO THIS MCM RESEARCH (OR THE RESULTS TO BE OBTAINED BY THE USE THEREOF), AND TO THE MAXIMUM EXTENT PERMITTED BY LAW, MCM HEREBY EXPRESSLY DISCLAIMS ALL WARRANTIES (INCLUDING, WITHOUT LIMITATION, ANY IMPLIED WARRANTIES OF ORIGINALITY, ACCURACY, TIMELINESS, NON-INFRINGEMENT, COMPLETENESS, MERCHANTABILITY AND/OR FITNESS FOR A PARTICULAR PURPOSE).
Index returns referenced in MCM Research, if any, are gross of any advisory fees, fund management fees, and trading expenses. Fund or ETF returns referenced, if any, are gross of advisory fees and trading expenses. Returns will be reduced by fees and expenses incurred.
