
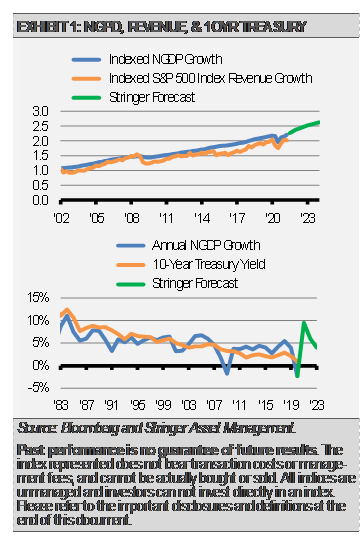
Most of the economic indicators that we track, such as monetary conditions and business surveys, point to solid economic growth in the coming months and continuing into 2022. Though still strong, we expect the pace of economic growth to slow and have trimmed our 2021 GDP expectation to 6.5%. More impactful for our work, nominal GDP (NGDP) should rise to its pre-COVID trend path in the coming six to nine months. NGDP, which is GDP plus inflation, has important implications for both corporate revenue growth and long-term interest rates. The positive relationships between NGDP and these other two factors is one of the reasons we call for continued, though muted and volatile, stock market gains and higher long-term interest rates.
Our economic growth expectation would be even higher if not for supply chain bottlenecks in everything from microchips to labor. We can see the effects of these supply chain bottlenecks in the latest Purchasing Manager Index (PMI) data that show the pace of growth slipping. Still, the slower pace of economic growth we may see going forward is very strong relative to the last business cycle.

Comments from survey respondents suggest supply constraints are holding back potential growth as well as fueling higher prices. While we may be nearing the peak in year-over-year inflationary numbers, core inflation may remain more persistent than market participants and policy makers expect.
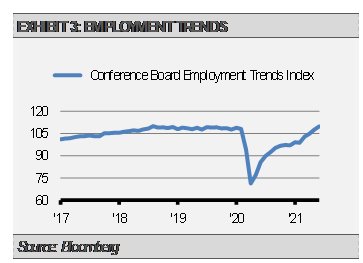
We think improved jobs creation numbers will continue after the acceleration in June’s jobs report. The latest Conference Board Employment Trends Index points to strong jobs growth in the months ahead. Higher wages combined with enhanced unemployment benefits being phased out, continued vaccine distribution, schools reopening in the fall, and the continuation of broader economic growth should propel faster jobs gains.
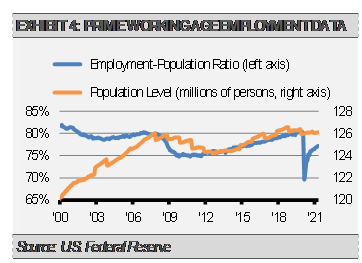
Additionally, we think that the labor market is tighter than the headline unemployment rate implies. Both the number of businesses saying jobs are hard to fill and the number of individuals saying that jobs are easy to find reflect tight labor market conditions. Furthermore, the headline unemployment rate may be distorted by both government intervention as well as the number of people who simply retired. We prefer to track data on prime age workers, which are those from 25-54 years old, as it includes those at their peak spending and earning years and is less subjected to distortions at both the younger and more mature ends of the spectrum.
Our work suggests that we still have some way to go before we get back to full employment for the prime age worker cohort, but substantial progress has been made. At the end of June, the prime age employment population ratio stood at 77.2%, down from the pre-COVID 80.5%. The prime age population is roughly 126 million, which means approximately 4 million new jobs are required to get the ratio back to 80.5%. This is far less than the 7 million fewer employed that we see in the press, and we think is more reflective of the actual labor market conditions. We expect as the economy continues to get back to more normal operation and jobs growth reaccelerates, we could see prime age workers at recovered employment figures by the end of 2021 or early 2022.
INVESTMENT IMPLICATIONS
A lot of this good news is already reflected in market prices in our opinion. We think that broad stock market valuations are stretched, and markets may be overly complacent. Stretched equity market valuations by nearly any metric as well as tight fixed income credit spreads suggest markets are pricing in a near perfect economic outcome with stable growth and low inflation. We find this unlikely given supply chain issues and building inflationary pressures.
Despite our expectations for strong economic growth during the second half of this year, our expectations for equity market gains are more muted. As a result, we have increased our diversification across equity sectors and increased defensive holdings in addition to the cyclical value positions that have worked so well this year.
We do think that the stock market’s upward trend will continue over time, but that stretched valuations combined with complacency makes the stock market vulnerable to shocks in the near-term. We look forward to redeploying these defensive assets in a more opportunistic fashion soon.
We are watching our indicators closely and will adjust quickly if we sense problems or other opportunities ahead. That flexibility is one of the benefits of having a tactical allocation where we can manage risk in real time.
THE CASH INDICATOR
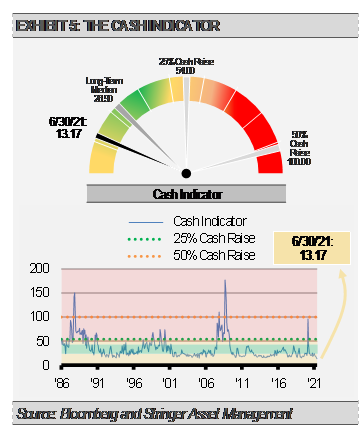
Our Cash Indicator (CI) has held at historically low levels. Though economic fundamentals remain strong, CI levels this low suggest that markets may be overly complacent and due for a shock. These types of shocks, or market corrections, tend to be short lived. Given the positive economic back drop, we see market shocks as a buying opportunity.
DISCLOSURES
Any forecasts, figures, opinions or investment techniques and strategies explained are Stringer Asset Management, LLC’s as of the date of publication. They are considered to be accurate at the time of writing, but no warranty of accuracy is given and no liability in respect to error or omission is accepted. They are subject to change without reference or notification. The views contained herein are not to be taken as advice or a recommendation to buy or sell any investment and the material should not be relied upon as containing sufficient information to support an investment decision. It should be noted that the value of investments and the income from them may fluctuate in accordance with market conditions and taxation agreements and investors may not get back the full amount invested.
Past performance and yield may not be a reliable guide to future performance. Current performance may be higher or lower than the performance quoted.
The securities identified and described may not represent all of the securities purchased, sold or recommended for client accounts. The reader should not assume that an investment in the securities identified was or will be profitable.
Data is provided by various sources and prepared by Stringer Asset Management, LLC and has not been verified or audited by an independent accountant.
Index Definitions:
S&P 500 Index – This Index is a capitalization-weighted index of 500 stocks. The Index is designed to measure performance of a broad domestic economy through changes in the aggregate market value of 500 stocks representing all major industries.
