
Confluence Investment Management offers various asset allocation products which are managed using “top down,” or macro, analysis. We publish asset allocation thoughts on a weekly basis in this report, updating the report every Friday, along with an accompanying podcast.
As market strategists, we’re always on the lookout for reliable indicators of future financial market performance wherever we can find them. Some indicators are strongly correlated by themselves, with performance yardsticks like stock prices, dividend yields, or bond yields. Other indicators are indexes composed of multiple data points, and they can point to future financial market performance as well. In this class, we would include the Citigroup Economic Surprise Index (CESI), which tracks whether a core set of economic data series has been coming in under expectations, at expectations, or over expectations. A review of the recent trend in the CESI shows it pointed to a drop in bond yields over the summer, despite investors’ growing concerns about rising inflation and Federal Reserve interest-rate hikes. Looking forward, the CESI now suggests bond yields could be relatively stable in the near term.
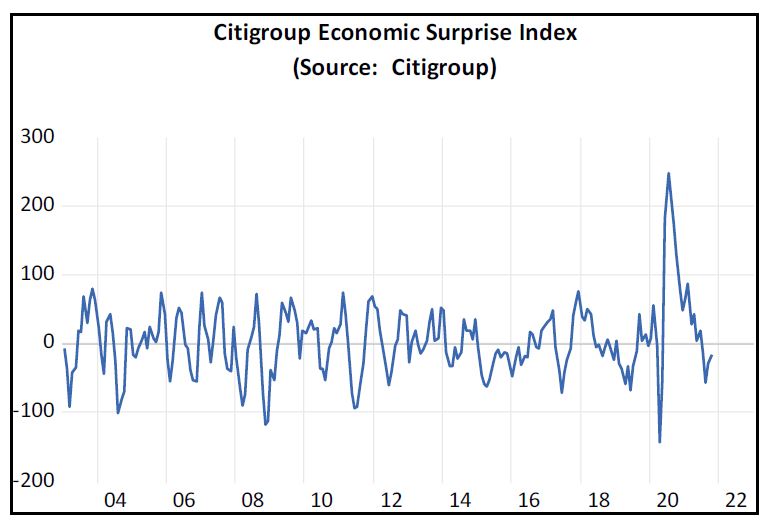
The graph below shows the CESI can be volatile, but that’s not necessarily because of the fits and starts of real economic activity. Rather, the index captures how economic indicators are coming in relative to investment analysts’ expectations. It, therefore, reflects analysts’ shifting optimism or pessimism and where they’ve been caught wrong-footed in their expectations. Calculated over a three-month rolling window, the index weights its constituent indicators based on how strongly positive or negative surprises in them have affected financial markets in the recent past. When the index is below zero, it means the constituent indicators have been coming in under anticipated levels, on balance, and vice versa. At the end of October, the index stood at -16.1, suggesting indicators have recently been disappointing.
Positive surprises or disappointments can affect investors’ willingness to buy assets, and statistical analysis confirms the relationship. In the chart below, we modeled the three-month change in the 10-Year Treasury yield (in basis points) based on the level of the CESI. Over time, lots of things affect Treasury yields, and the CESI certainly doesn’t explain the majority of the move in yields. Yields often move more or less than our model might suggest. Nevertheless, the analysis offers positive confirmation that there is a relationship between the two variables. We think that relationship can be one tool in understanding where bond yields might be heading.
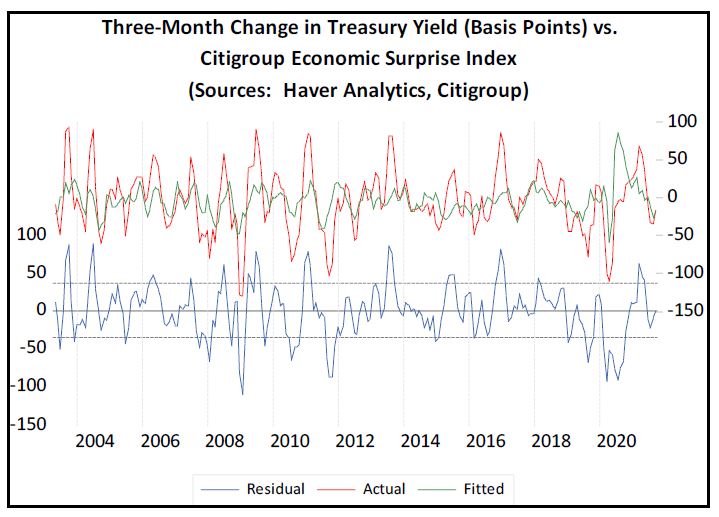
Since the middle of last year, for example, the CESI has been weakening as the economy’s initial, unexpectedly strong recovery from the coronavirus pandemic began to moderate. The model, therefore, predicted that the rise in Treasury yields should start to slow and then turn negative (the green line). However, investors were slow to focus on the moderating recovery. Bond yields were driven sharply higher by greater optimism about growth and rising concerns about inflation and Fed rate hikes. Yields sharply accelerated during the spring until they reached a level far above what the model would have suggested (the red line). In other words, the rise in yields accelerated well beyond what would have been expected given the reduced level of positive surprises in the economic data. This condition provided a hint that the sell-off in bonds and the associated spike in yields might be ready to end or reverse, which is one reason we became more willing to own longer-maturity bonds in our asset allocation strategies during the spring.
What is the CESI signaling now? As shown in the chart, recent yield fluctuations have been right in line with what our model would suggest. If positive and negative data surprises now remain closer to their historical balance and the CESI stabilizes, bond prices could remain close to their current levels. Furthermore, yields could stay in a relatively limited range for the time being, in spite of some investors’ concerns about rising inflation and tighter monetary policy.
Past performance is no guarantee of future results. Information provided in this report is for educational and illustrative purposes only and should not be construed as individualized investment advice or a recommendation. The investment or strategy discussed may not be suitable for all investors. Investors must make their own decisions based on their specific investment objectives and financial circumstances. Opinions expressed are current as of the date shown and are subject to change.
This report was prepared by Confluence Investment Management LLC and reflects the current opinion of the authors. It is based upon sources and data believed to be accurate and reliable. Opinions and forward-looking statements expressed are subject to change. This is not a solicitation or an offer to buy or sell any security.
