
Although there are always sundry risks to financial markets, a proximate and substantial risk comes from inflation. Of course, there is always risk of some degree of generalized price changes to financial assets. It also is important to realize that there is always some degree of inflation or deflation in an economy. Prices are rarely perfectly stable. The goal of policymakers is not necessarily to rid an economy of inflation but to have a degree of price stability so that economic actors don’t feel compelled to take price changes into account when making decisions. Overall, societies can generally cope with modest changes in prices over a year, which has led central banks to target inflation around 2%. There is nothing particularly special about 2%, other than it seems to work. It is also possible that 3% would work as well.
A price index is a basket of goods and services and their prices are subject to micro changes in a particular market and macro changes that affect prices from policy variables or other markets. For example, the price of crude oil is affected by the supply and demand for the product (the micro). It is also affected by exchange rates, the cost of public transportation, employment, etc. For a basket of goods, weighted by some methodology, the causal factors are not only impossibly large but unstable; in other words, there are lots of inputs that affect an inflation index, and the impact of these inputs can vary over time.
In the face of such complexity, there is a clear desire for simplicity from policymakers, economic actors, and investors. Economic theory has tried to provide simple rules. Monetarists suggested that monitoring the money supply is sufficient. Keynesians offered the Phillips Curve. Supply side economists argued that inflation was generated from excessive regulation. Others suggested that excessive fiscal spending was the culprit. Exchange rates seemed to have an impact. At times, these explanations have worked; in others, they have failed. Our take is that because the factors that trigger inflation are complicated, the conditions surrounding a change in the money supply, a decline in unemployment, an increase in regulation, additional fiscal spending, or a currency depreciation matter greatly.
Another important factor is inflation expectations. Our view is that inflation has an element of a balance sheet decision. Essentially, households and businesses receive liquidity and make a balance sheet decision on how it is held. If there is confidence that inflation will remain low and the return on cash is high enough, it will be held either as cash or in a near equivalent. If inflation expectations remain low but the returns on cash and near-cash instruments are low, financial assets are the likely destination. If inflation fears are elevated, the cash will be converted to real assets. For businesses, this may mean accumulated inventory. For households, this can be accomplished by purchases of consumer durables (cars, houses) or food in the freezer and canned goods in the basement.
Measuring inflation expectations is far from exact. The TIPS market provides a market estimate, but it seems to closely track crude oil, suggesting that market participants are not necessarily in possession of any great insight. Since 2008, the implied inflation rate from the TIPS market and oil prices are correlated at the 76.5% level. There are inflation surveys as well, but our read is that they tend to reflect the recent past. Milton Friedman argued that inflation expectations tend to be built over a lifetime; in our modeling, we use a 15-year average of the yearly change in CPI as a proxy.
For the next few months, we are likely to see what appears to be a spike in inflation.
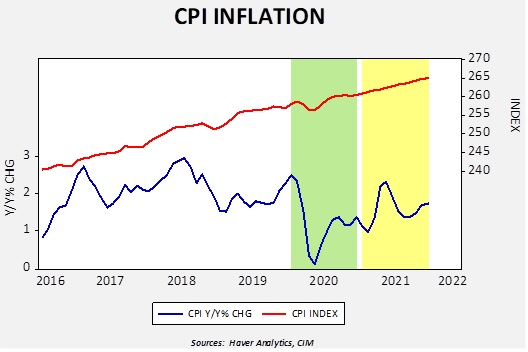
This chart shows the CPI Index (upper line) and the year-over-year percentage change (lower line). The area shaded green shows last year. Note that from February through May, the index fell and then rose. This time period represents the first pandemic lockdowns which led to a sharp drop in economic activity and price levels. The lower line shows that the yearly inflation rate fell to 0.1% in May before it began to rise as economic activity restarted.
In the yellow area, we show how inflation will behave assuming the index grows at 0.015% per month, which is the average monthly rate over the past five years. Using that assumption, due to base effects, we will see a rather sharp rise in yearly inflation in the second quarter where overall CPI will rise to 2.3% in May. If the overall index rises faster, the yearly change will as well. The point of this exercise is to warn investors that there will be a rise in reported inflation coming soon. It doesn’t necessarily mean that the rise will be sustained, but we would expect concerns to be raised which may adversely affect financial markets.
These reports were prepared by Confluence Investment Management LLC and reflect the current opinion of the authors. Opinions expressed are current as of the date shown and are based upon sources and data believed to be accurate and reliable. Opinions and forward-looking statements expressed are subject to change. This is not a solicitation or an offer to buy or sell any security. Past performance is no guarantee of future results. Information provided in this report is for educational and illustrative purposes only and should not be construed as individualized investment advice or a recommendation. Investments or strategies discussed may not be suitable for all investors. Investors must make their own decisions based on their specific investment objectives and financial circumstances.
