
By Chris Konstantinos, CFA, Director of Investments, Chief Investment Committee
SUMMARY
- Volatility is back as war in Europe and inflation has rattled investors.
- We believe our ‘Four I’s’ – Inflation, Interest Rates, Innovation, and Intrinsic Value, will determine market direction from here.
- Our optimism is dependent on inflation cresting, interest rates remaining relatively low, innovation offsetting higher costs, and corporate earnings staying robust.
Update On The “Four I’s”: Inflation, Interest Rates, Innovation, & Intrinsic Value Still As Relevant As Last Year
We are proud to release our April 2022 Chart Pack – our visual quarterly designed to walk investors through our views on what’s happening and why, predictions about what may come next, and positioning in our RiverFront portfolios. In today’s Weekly View, we created a concise synopsis of four selected visuals from the Chart Pack that encapsulate a number of key takeaways.
The ‘mechanical bull’ we cited back in December in our 2022 Outlook as an analogy for stock markets in 2022 has turned into a ‘bucking bronco’. Volatility is back in a big way as war in eastern Europe has investors rattled and commodity prices soaring. We believe the ‘Four I’s’ first mentioned in our Outlook – Inflation, Interest Rates, Innovation, and Intrinsic Value – are as relevant now as they were when we wrote the Outlook. We revisit these market drivers here through the lens of geopolitical uncertainty overseas.
Inflation: Faster, Higher; Europe Uniquely At Risk Due To Russian Gas
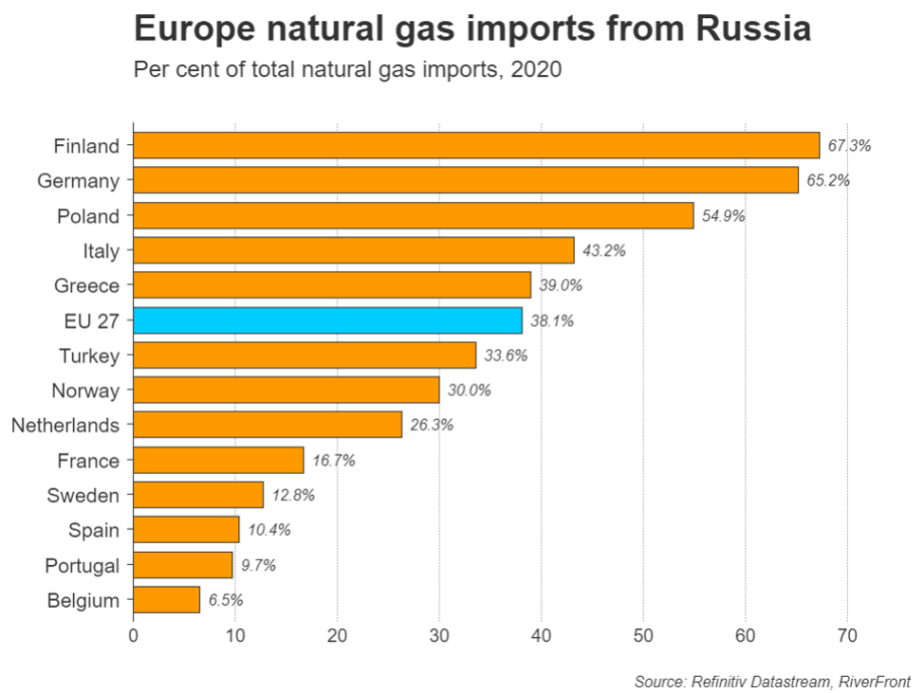
Source: Refinitiv Datastream/RiverFront; data annually as of 2020. Chart shown for illustrative purposes only.
At the risk of stating the obvious, Russia’s invasion is wreaking havoc on global commodity prices. Russia is a major exporter of oil and gas, and Ukraine is a major supplier of grains. Invasion related disruptions in energy and agricultural supply chains, as well as the economic effect of sanctions, drove commodities to multi-year highs in the first quarter.
In our opinion, this is having a particularly detrimental economic effect in Europe, a continent deeply reliant on Russia for natural gas (see bar chart, above) and struggling to deal with its uneven recovery from the pandemic. Energy inflation is currently over 40% year-over-year, sparking legitimate fears of European ‘stagflation’.
In the US, inflation concerns are also top of mind. Headline Consumer Price Index (CPI) is currently at 8.5%, its highest level since the early 1980’s. However, under the surface, core inflation appears tamer. In our view, the “stickiest” parts of the Consumer Price Index (CPI) basket, like household furnishings, medical care, eating out, and education, represent a tamer picture of inflation than food, energy and auto prices, which are more volatile.
Currently, core ‘sticky’ CPI is trending at ~4.6%. This is different than the 1970’s, when even sticky CPI items skyrocketed. However, we recognize that the trend is alarming.
Interest Rates: Yield Curve Still Positive

Source: Refinitiv Datastream/Fathom Consulting. Data monthly, as of 4/15/2022. Chart shown for illustrative purposes only.
Whether a major stock market pullback is followed by a subsequent economic recession matters for future
returns. A Ned Davis Research study shows that, over the past 50 years, cyclical bear markets in the Dow Jones Industrial Average (DJIA) that are not overlapped by recession have an average peak-to-trough loss of roughly 18% and last about 7 months.
When overlapped by recession, bear markets are far worse: -33% loss and last about 17 months on average.
While a spike in commodity prices often precedes recession, two other well-established indicators of impending recession remain healthy:
- The US 3 month-to-10-year Treasury yield curve remains well above zero, a positive in our opinion (see chart, right)
- Leading economic surveys such as the Purchasing Managers’ Index remain in expansionary territory for the US (chart, below)
Innovation: An Important Offset To Inflation, Especially In The Developed World
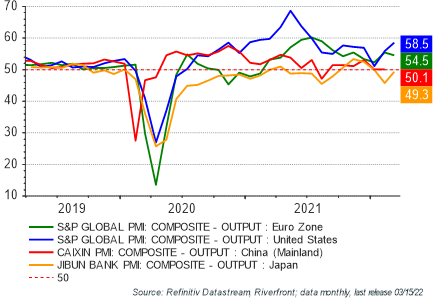
Source: Refinitiv Datastream/RiverFront. Data monthly, as of 3/15/22. Chart shown for illustrative purposes only.
Current readings well above 50 on the composite Purchasing Manager Index (PMI) surveys (see chart, left) suggests to us that the US economy is in healthy shape as it heads into an uncertain time for Fed policy…a crucial positive, in our opinion. We attribute this to not only the US’s geographic and energy production advantages, but also the benefits of a more flexible, innovative, and productive economy versus international peers. While European PMIs also appear healthy, we expect European sentiment to suffer going forward due to the economic impact of higher inflation and Russian sanctions. China and Japan have been at or under 50 for most of the year, reflecting muted business sentiment.
Intrinsic Value: Market Valuation Lower Than In ’21; As Long As Earnings Stay Robust, US Large-Cap Valuations Look Attractive To Us
To start the year, one of the least attractive aspects of the stock market, to us, was its high valuation.
At the time, the S&P 500 level was around 4750 and was trading for roughly 21 times 2022 estimated earnings. Today, the market multiple is about 2 multiple points cheaper (19x) on 12-month forward earnings, making US stocks more attractive to us.
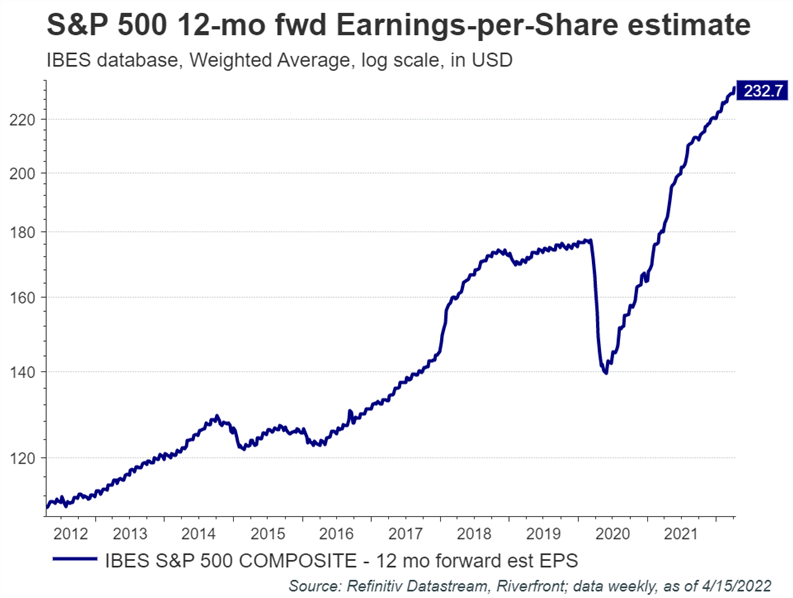
Source: Refinitiv Datastream/RiverFront. Data weekly, as of 4/15/22. Chart shown for illustrative purposes only.
The stock market’s lower valuation is a mirage if earnings subsequently collapse, and thus we are watching analysts’ earnings revisions closely. Thus far, earnings forecasts have stayed robust. Currently, analysts estimate the S&P 500 12-month forward earnings at close to $230 per share, an increase of about 20% over the last year, and up over $12 from the estimate at the beginning of the year (see chart, left).
Bottom Line: We Remain Constructive…Watching ‘Four I’s’ Closely
With the first quarter behind us and much bad news already reflected in global stock prices, we believe equity returns can improve throughout the rest of the year. Our optimistic outlook is dependent on inflation cresting, interest rates remaining relatively low, innovation offsetting higher costs and corporate earnings staying robust.
Important Disclosure Information:
The comments above refer generally to financial markets and not RiverFront portfolios or any related performance. Opinions expressed are current as of the date shown and are subject to change. Past performance is not indicative of future results and diversification does not ensure a profit or protect against loss. All investments carry some level of risk, including loss of principal. An investment cannot be made directly in an index.
Chartered Financial Analyst is a professional designation given by the CFA Institute (formerly AIMR) that measures the competence and integrity of financial analysts. Candidates are required to pass three levels of exams covering areas such as accounting, economics, ethics, money management and security analysis. Four years of investment/financial career experience are required before one can become a CFA charterholder. Enrollees in the program must hold a bachelor’s degree.
All charts shown for illustrative purposes only. Information or data shown or used in this material was received from sources believed to be reliable, but accuracy is not guaranteed.
This report does not provide recipients with information or advice that is sufficient on which to base an investment decision. This report does not take into account the specific investment objectives, financial situation or need of any particular client and may not be suitable for all types of investors. Recipients should consider the contents of this report as a single factor in making an investment decision. Additional fundamental and other analyses would be required to make an investment decision about any individual security identified in this report.
Standard & Poor’s (S&P) 500 Index TR USD (Large Cap) measures the performance of 500 large cap stocks, which together represent about 80% of the total US equities market.
Investing in foreign companies poses additional risks since political and economic events unique to a country or region may affect those markets and their issuers. In addition to such general international risks, the portfolio may also be exposed to currency fluctuation risks and emerging markets risks as described further below.
Changes in the value of foreign currencies compared to the U.S. dollar may affect (positively or negatively) the value of the portfolio’s investments. Such currency movements may occur separately from, and/or in response to, events that do not otherwise affect the value of the security in the issuer’s home country. Also, the value of the portfolio may be influenced by currency exchange control regulations. The currencies of emerging market countries may experience significant declines against the U.S. dollar, and devaluation may occur subsequent to investments in these currencies by the portfolio.
Foreign investments, especially investments in emerging markets, can be riskier and more volatile than investments in the U.S. and are considered speculative and subject to heightened risks in addition to the general risks of investing in non-U.S. securities. Also, inflation and rapid fluctuations in inflation rates have had, and may continue to have, negative effects on the economies and securities markets of certain emerging market countries.
In a rising interest rate environment, the value of fixed-income securities generally declines.
Stocks represent partial ownership of a corporation. If the corporation does well, its value increases, and investors share in the appreciation. However, if it goes bankrupt, or performs poorly, investors can lose their entire initial investment (i.e., the stock price can go to zero).
Bonds represent a loan made by an investor to a corporation or government. As such, the investor gets a guaranteed interest rate for a specific period of time and expects to get their original investment back at the end of that time period, along with the interest earned. Investment risk is repayment of the principal (amount invested). In the event of a bankruptcy or other corporate disruption, bonds are senior to stocks. Investors should be aware of these differences prior to investing.
Buying commodities allows for a source of diversification for those sophisticated persons who wish to add this asset class to their portfolios and who are prepared to assume the risks inherent in the commodities market. Any commodity purchase represents a transaction in a non-income-producing asset and is highly speculative. Therefore, commodities should not represent a significant portion of an individual’s portfolio.
RiverFront Investment Group, LLC (“RiverFront”), is a registered investment adviser with the Securities and Exchange Commission. Registration as an investment adviser does not imply any level of skill or expertise. Any discussion of specific securities is provided for informational purposes only and should not be deemed as investment advice or a recommendation to buy or sell any individual security mentioned. RiverFront is affiliated with Robert W. Baird & Co. Incorporated (“Baird”), member FINRA/SIPC, from its minority ownership interest in RiverFront. RiverFront is owned primarily by its employees through RiverFront Investment Holding Group, LLC, the holding company for RiverFront. Baird Financial Corporation (BFC) is a minority owner of RiverFront Investment Holding Group, LLC and therefore an indirect owner of RiverFront. BFC is the parent company of Robert W. Baird & Co. Incorporated, a registered broker/dealer and investment adviser.
To review other risks and more information about RiverFront, please visit the website at www.riverfrontig.com and the Form ADV, Part 2A. Copyright ©2022 RiverFront Investment Group. All Rights Reserved. ID 2155303
