
By Gary Stringer, Kim Escue and Chad Keller, Stringer Asset Management
After a significant recovery in the first quarter, second quarter returns began to reflect fair valuation in what is a slower growth global economy. More recently, as is often the case late in the business cycle, headline risks have increased market volatility. There is also no shortage of headlines with a trade war, U.S. Federal Reserve policy decisions, Brexit, and unrest in China. As they say, “if it bleeds it leads” and that makes for a jittery market.
However, none of those risks lead us to the conclusion that these headlines are critically impactful to the long-term health of our economy. Domestically, the yield curve has inverted, which is typically a negative sign, due to the softening global economy and negative interest rates abroad. However, the yield curve is a long lead-time signal (up to two years) and a lot can change over that timeframe. In the meantime, our more near-term signals suggest continued U.S. economic growth. For instance, jobs growth remains solid, layoffs are near all-time lows, and the number of job openings is near record highs.
The U.S. economy is domestically oriented with nearly 90% of our activity dependent upon transactions happening within our borders. We are just not that reliant on what happens outside of this country. Furthermore, our signals, including composite PMIs (exhibit 1), suggest that the pace of global economic growth is stabilizing near the long-term potential for each major economy.
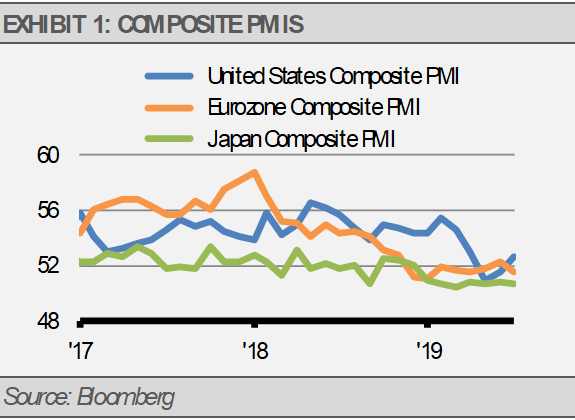
Additionally, we think that it is a confluence of factors that contributed to the pace of U.S. economic growth stabilizing near our estimated 2% real (inflation adjusted) annual rate. Similarly, economies in both the euro zone and Japan are stabilizing near 1% annual real growth.
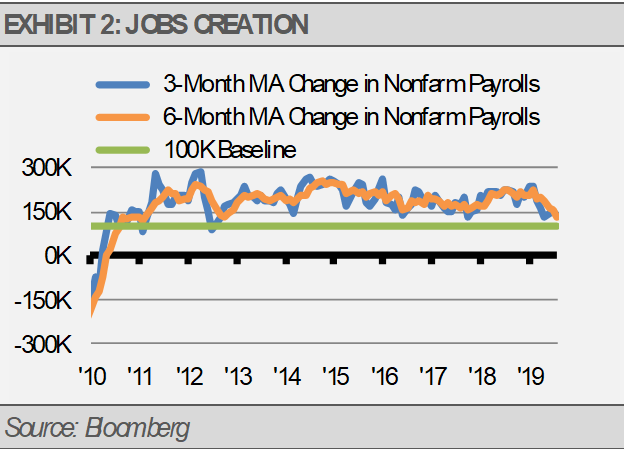
Confirming the slowdown in the pace of economic growth and the continuation of the business cycle with no near-term recession is the slowdown in the pace of U.S. jobs creation (exhibit 2). We prefer to track jobs creation on a rolling basis rather than monthly due to the volatility of the monthly numbers. We estimate that the U.S. labor force increases by approximately 100K new entrants per month. An average monthly jobs creation rate near 100K new jobs per month or better signals good health for the labor market.
Importantly, slower global economic growth can still lead to higher stock market levels and gains for investors. For the U.S., we think that this pace of economic growth translates to corporate revenue growth of about 4% annually (exhibit 3) while earnings growth should be somewhat higher than that. The total return to investors, subject to volatility, should average close to the earnings growth rate plus the annual dividend yield.
Along with the slowing pace of economic growth, we expect equity market volatility. Given this outlook, we think that investors should view equity market volatility as an investment opportunity. For our part, we have been adjusting our Strategies to better weather anticipated volatility, which is consistent with our process of managing risk in real time.

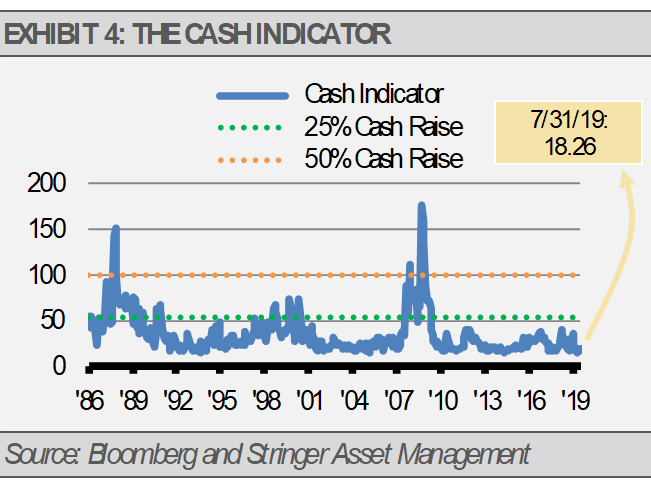
THE CASH INDICATOR
The Cash Indicator (CI) is well below its historic average and median levels. Consistent with the softening of our forward-looking indicators suggesting volatility is near, the CI has been moving with market gyrations. Still, the CI implies that we are far from a crisis situation. More likely, the markets may be due for bouts of volatility that are best managed through shifts in tactical allocations.
This article was written by Gary Stringer, CIO, Kim Escue, Senior Portfolio Manager, and Chad Keller, COO and CCO at Stringer Asset Management, a participant in the ETF Strategist Channel.
DISCLOSURES
Any forecasts, figures, opinions or investment techniques and strategies explained are Stringer Asset Management LLC’s as of the date of publication. They are considered to be accurate at the time of writing, but no warranty of accuracy is given and no liability in respect to error or omission is accepted. They are subject to change without reference or notification. The views contained herein are not be taken as an advice or a recommendation to buy or sell any investment and the material should not be relied upon as containing sufficient information to support an investment decision. It should be noted that the value of investments and the income from them may fluctuate in accordance with market conditions and taxation agreements and investors may not get back the full amount invested. Past performance and yield may not be a reliable guide to future performance. Current performance may be higher or lower than the performance quoted.
The securities and strategies identified and described may not represent all of the securities purchased, sold or recommended for client accounts. The reader should not assume that an investment in the securities identified was or will be profitable.
Data is provided by various sources and prepared by Stringer Asset Management LLC and has not been verified or audited by an independent accountant.
Index Definitions:
S&P 500 Index – This Index is a capitalization-weighted index of 500 stocks. The Index is designed to measure performance of a broad domestic economy through changes in the aggregate market value of 500 stocks representing all major industries.
