
By Gary Stringer, Kim Escue and Chad Keller, Stringer Asset Management
While election years may result in market volatility, any election outcome is unlikely to have a significant economic impact. Over time, markets will reflect economic fundamentals, such as productivity growth, labor force growth and inflation. Each of these fundamentals have little to do with the executive branch.
Similarly, geopolitical risks of the scale we are likely to see in the coming weeks and months should have little impact on the U.S. economy. Rather, despite broader implications, these types of events tend to spur temporary equity market declines which are often quickly reversed.

In aggregate, our economic signals suggest a stable, slow-growing economy ahead. Though we see positive signs in many broad measures, such as liquidity growth improvements as well as increases in housing construction and residential investment, we cannot forget that the yield curve inverted last year, which is a cautionary signal.
Overall, our base-case scenario is constructive and built on solid U.S. economic fundamentals. Global economic growth rates appear to be stabilizing at historically low levels after slowing since 2018.
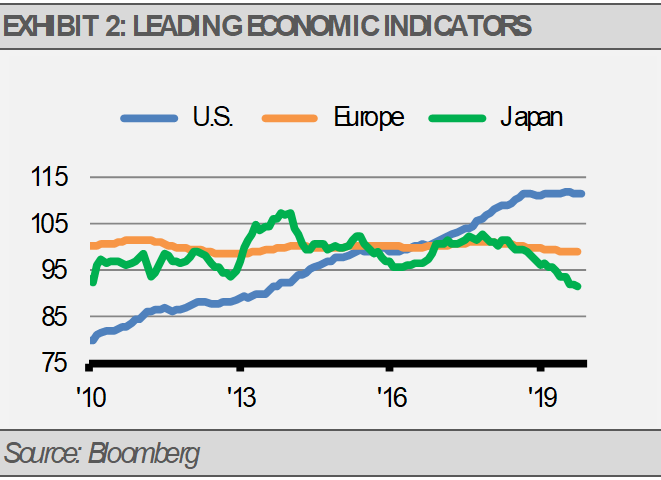
Our collection of more near-term signals, such as Leading Economic Indicators (LEIs), continue to suggest slow and steady economic growth overall.
We expect 2% real U.S. GDP growth over the near-term. Foreign economies, such as the euro zone and Japan, look less robust with growth barely positive.
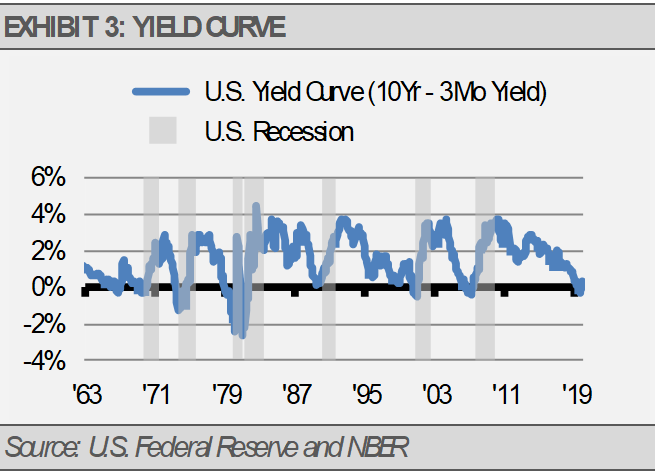
Domestically, the yield curve is one of the indicators that we track to gauge the probability for future recessions. When short-term interest rates are higher than long-term interest rates, as they were from May through September, the curve is forecasting an economic contraction 3-18 months ahead. Though we have seen some recent improvement, we are not out of the woods yet.
Similarly, automobile production and residential investment are economically sensitive. Though they account for a small part of our economy, these two measures have proven to be good indicators of future broad economic activity. Currently, these indicators are mixed overall. However, these long lead time indicators may be up to two years early and a lot can happen in that time.

Our near-term indicators continue to suggest slow and steady economic growth ahead. We are pleased that the U.S. Federal Reserve (Fed) changed course during the second half of 2019 by reducing short-term interest rates and are again expanding the size of their balance sheet. The slow-growth global economy demands lower interest rates than we had at the start of 2019. At the same time, the high global demand for U.S. currency leads to further balance sheet expansion.
We think that U.S. monetary policy is well positioned to support further economic growth, as we can see with the increased pace of liquidity growth as measured by M1.

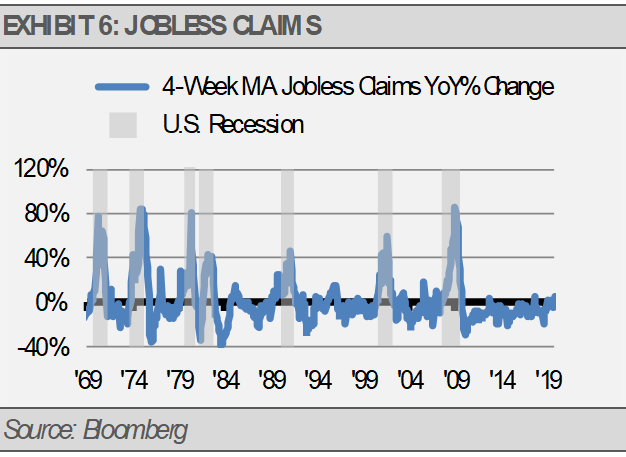
The U.S. jobs market contains important near-term indicators as well. For example, weekly jobless claims (layoffs) tend to spike 15-20% in the months preceding a recession. Currently, the year-over-year change is near 0%, which suggests slow growth but not a recession. The number of layoffs can only get so low and the current rate of change makes sense late in a business cycle.
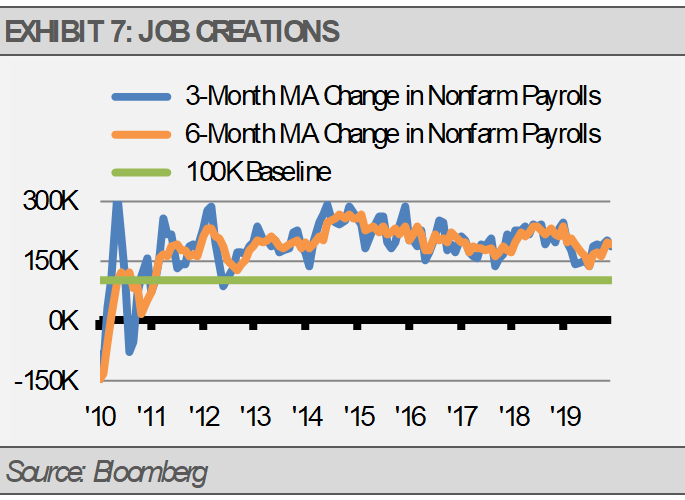
Further confirmation of slow and steady growth comes from monthly jobs creation as the amount of change in the headline unemployment rate can be telling. The headline unemployment rate tends to increase marginally from year-ago levels on the cusp of recession (the current change is near 0%). We prefer to track jobs creation on a rolling basis rather than monthly due to the volatility of the monthly numbers. An average monthly jobs creation rate near 100K new jobs per month or better signals a healthy labor market.
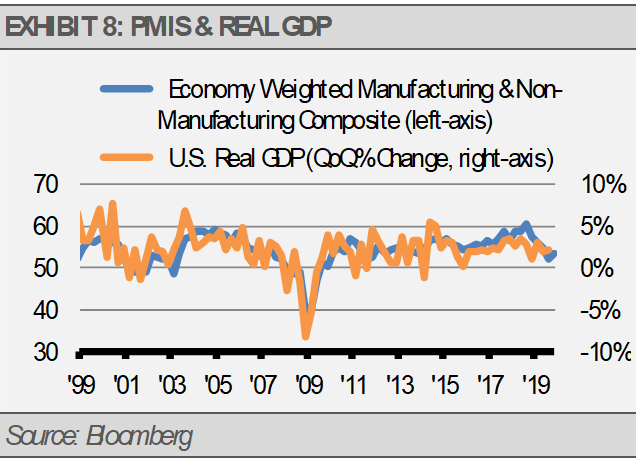
Business surveys, such as Purchasing Manager Indices (PMI), also offer important information. An increase in PMIs suggests increasing economic growth while a decline suggests economic slowing. Additionally, PMIs often drop close to 45 prior to a recession. Currently, PMIs are stabilizing for each major economy and region that we track.
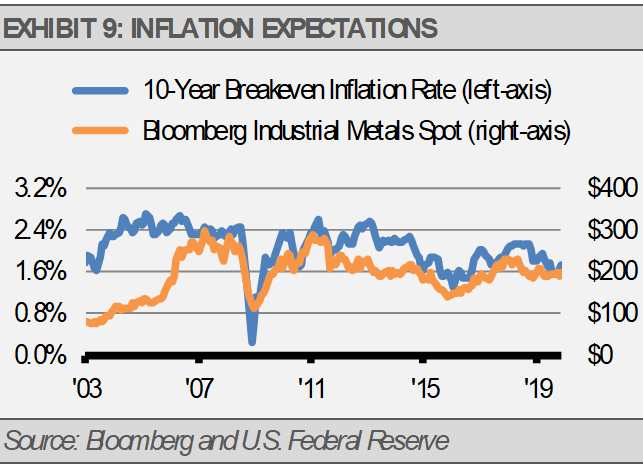
Inflation is another important factor to consider as some inflation is good for corporate revenue growth. Treasury Inflation Protected Securities (TIPS) spreads and industrial metals’ prices provide useful insights for inflation trends and tend to move together. Both measures have recovered from their lows but are still far below their 2018 highs when U.S. economic growth was accelerating. These market-based inflation measures suggest the Fed is not likely to hit their 2% target.
INVESTMENT IMPLICATIONS
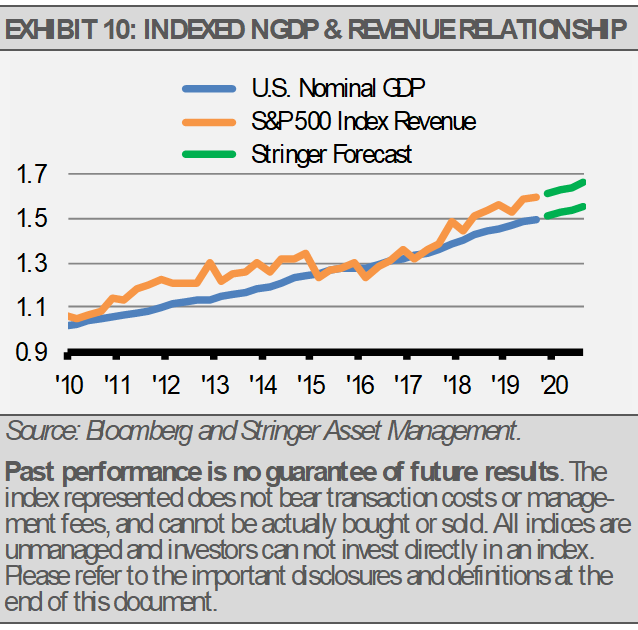
Meanwhile, consensus estimates for 2020 earnings growth are significantly higher than our expectations. While we expect earnings to grow in 2020 and stock prices to move broadly higher, we are not as enthusiastic as some. According to FactSet, 2020 earnings for S&P 500 Index companies are expected to be up 9.6% over 2019, which is higher than the 10-year average of 9.1%.
The combination of slow economic growth and higher labor costs pegs our 2020 earnings growth expectation at 5%. Similarly, equity valuations based on an earnings yield of 5% plus a dividend yield of nearly 2% results in a 7% equity market total return expectation. Meanwhile, the current SEC yield of approximately 2.5% seems like a reasonable expectation for high quality, taxable domestic bond returns going forward.

Though equity valuations in some foreign countries look attractive, their lack of economic growth keeps our foreign equity allocations defensively minded using consumer staples, health care, and infrastructure for our investment themes.
We were more bullish last year than many based on the relatively low equity valuations. For 2020, we are less bullish. In our 2019 outlook, we showed how valuations were compelling for forward returns, however, our current expectations for forward returns are more tempered.
We think that the markets have now priced in a lot of good news so disappointments can bring significant volatility.
Our work suggests than any recession we might see in the coming years is likely to be shallow and short-lived largely due to tighter regulations and a lack of bank industry leverage.
Overall, our risk-first approach and conservative outlook keep us focused on consistent corporate earnings and dividends, high quality
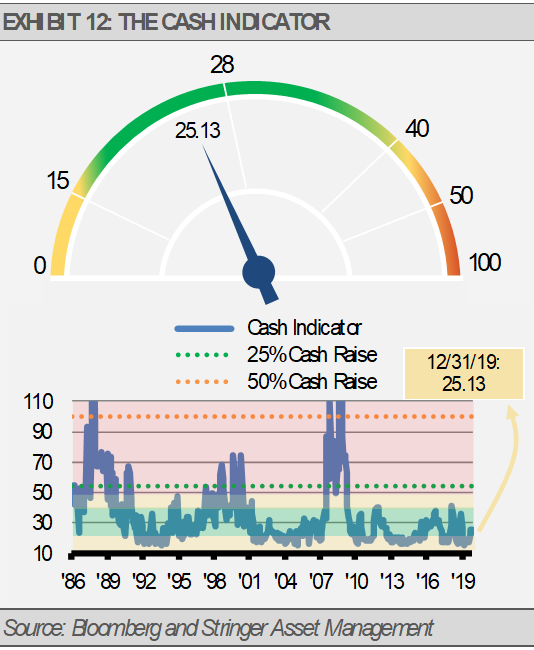
THE CASH INDICATOR
Our proprietary Cash Indicator (CI) continues to suggest that markets are functioning normally. After rising from low levels last year, the CI is now only slightly below its historical median value. This suggests that the markets have priced in a moderate level of risk while valuations appear stretched. We anticipate near-term volatility, but not a crisis.
This article was written by Gary Stringer, CIO, Kim Escue, Senior Portfolio Manager, and Chad Keller, COO and CCO at Stringer Asset Management, a participant in the ETF Strategist Channel.
DISCLOSURES
Any forecasts, figures, opinions or investment techniques and strategies explained are Stringer Asset Management LLC’s as of the date of publication. They are considered to be accurate at the time of writing, but no warranty of accuracy is given and no liability in respect to error or omission is accepted. They are subject to change without reference or notification. The views contained herein are not be taken as an advice or a recommendation to buy or sell any investment and the material should not be relied upon as containing sufficient information to support an investment decision. It should be noted that the value of investments and the income from them may fluctuate in accordance with market conditions and taxation agreements and investors may not get back the full amount invested. Past performance and yield may not be a reliable guide to future performance. Current performance may be higher or lower than the performance quoted.
The securities and strategies identified and described may not represent all of the securities purchased, sold or recommended for client accounts. The reader should not assume that an investment in the securities identified was or will be profitable.
Data is provided by various sources and prepared by Stringer Asset Management LLC and has not been verified or audited by an independent accountant.
Index Definitions:
Bloomberg Barclays U.S. Aggregate Bond Index – This Index provides a measure of the U.S. investment grade bond market, which includes investment grade U.S. Government bonds, investment grade corporate bonds, mortgage pass-through securities and asset-backed securities that are publicly offered for sale in the United States. The securities in the Index must have at least 1 year remaining to maturity. In addition, the securities must be denominated in US dollars and must be fixed rate, nonconvertible and taxable.
MSCI ACWI Index – This Index is a free float-adjusted market capitalization weighted index that is designed to measure the equity market performance of developed and emerging markets. The MSCI ACWI Index consists of 23 developed and 23 emerging market country indexes. Net total return includes the reinvestment of dividends after the deduction of withholding taxes, using a tax rate applicable to non-resident institutional investors who do not benefit from double taxation treaties.
S&P 500 Index – This Index is a capitalization-weighted index of 500 stocks. The Index is designed to measure performance of a broad domestic economy through changes in the aggregate market value of 500 stocks representing all major industries.
