
By Chris Konstantinos, CFA, Director of Investments, Chief Investment Strategist
SUMMARY
- We anticipated greater volatility in 2022 and are now seeing it.
- In our view, this volatility is linked to expectations that interest rates will rise faster than previously expected.
- While our risk discipline has caused us to make portfolio adjustments, we remain constructive on stocks for the year as a whole.
We remain constructive on stocks but watching price trends, inflation, and rates closely.
After an abnormally relaxed 2021 – a year that saw historically low volatility and outsized gains in stocks around the world – so far 2022 is bucking like the proverbial mechanical bull featured on the cover of our 2022 Outlook Summary- Riding the Recovery (Outlook). In the Outlook we predicted higher market volatility, and January obliged…with the US leading the rest of the world’s markets down in one of the worst months since 2020.
In collating this week’s Frequently Asked Questions (FAQ) from our clients, we provide context for our views surrounding what is happening and why, what we have done about it in our Asset Allocation portfolios, and what risk factors we are watching going forward.
Why Is the Market Selling Off? Fed’s Views Have Turned Hawkish
The market is increasingly alarmed by the persistence and magnitude of inflationary trends, as epitomized by the most recent headline Consumer Price Index report (CPI) of 7%, the highest reading since 1982. This high level of CPI is exacerbated, in our opinion, by current factors such as the spread of the Omicron COVID-19 variant and its impact on the supply chain, as well as geopolitical tension in Ukraine, which has intensified spikes in energy prices. Inflation itself isn’t necessarily bad for stocks, as it tends to be positively correlated to corporate earnings growth, especially for cyclical companies. Where inflation hurts stocks, in our opinion, is when it causes the US Federal Reserve (Fed) to tighten monetary and interest rate policy faster than the market was expecting, causing downward pressure on stock valuations; rising interest rates negatively impact the value of future earnings, and can slow the economy.

Source: Refinitiv DataStream, RiverFront Chart shown as of 1/28/22 for illustrative purposes only.
The Fed’s body language around rate hikes has turned much more hawkish over the last month, in response to unexpectedly persistent inflation
- The vertical axis on the chart to the left displays the expected future Federal Funds Rate (Fed Funds), as interpolated by signals in the Fed Funds futures market. The horizontal axis shows where that anticipated Fed Funds rate is expected to be at various points over the next two years.
- Currently, the Fed has kept the Funds Rate at zero but, given their guidance from the Federal Open Market Committee (FOMC) press conference held on January 26, it is all but guaranteed to hike rates in the near term. By comparing the position of the various lines on the vertical axis, one can see how dramatically higher the expected future Fed Funds rate is today (darkest blue line), versus one or three months ago (lines are same analysis but conducted 1, 3 and 6 months ago, respectively).
- Effectively, we think the market went from pricing in 2-3 rate hikes just a few months ago in 2021 to now more like 4-5 hikes.
What Is Our View on This Weakness?
-

Source: Refinitiv DataStream, RiverFront Chart shown as of 1/28/22 for illustrative purposes only.
Our Outlook ‘base’ case scenario remains that, despite Fed hawkishness, the economy and corporate earnings will stay on track in 2022, more than offsetting any valuation contraction due to higher rates. Thus, we think modest stock market gains are still possible by the end of the year (2022 Outlook).
- We also believe that US inflation will peak in the first half of 2022, which may take some pressure off the Fed to continue their hawkish leanings. To this end, leading indicators of global inflation such as global shipping rates for raw materials are already moderating (see chart to right), and inflation expectations embedded in various parts of the bond market are declining.
- While we tend to favor a more cyclical and value-oriented industry allocation in our portfolios, we also believe that certain areas of ‘growth’, including a number of large, highly profitable tech companies, will continue to be strong earnings growers and attractive investments.
However, in the spirit of Riverfront’s investment motto of ‘process over prediction’, we acknowledge that the direction of Fed policy and inflation is currently trending more towards our ‘Bear’ case thus far in 2022, even as macroeconomic strength is closer to our ‘Base’ case. We acknowledge that the recent violation of the S&P 500’s 200-day moving average may represent an important negative trend change in the near-term. (See chart, below). This caused us to make changes in the portfolios, as outlined below in the Portfolio Strategy section.
Risk Indicators We Are Monitoring
Source: Refinitiv DataStream, RiverFront Chart shown as of 1/28/22 for illustrative purposes only.
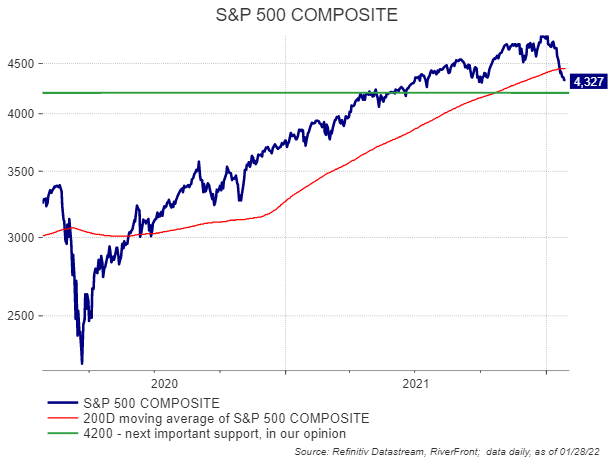
Important technical levels (see chart, right)
- The 200-day moving average (red line, chart on right) on the S&P 500 was violated for the first time since the pandemic recovery on 1/22; this suggests to us that we may be in for our first meaningful correction in quite some time.
- The next important support for the S&P 500 is around 4,200, in our opinion (green line); we would view a decisive violation of this level as a negative.
- Yield curve (spread between short and long-term interest rates): bond investors traditionally have watched the relationship between the 2-year and 10-year treasury bond yield as a gauge for the economic cycle. When the 2-year rises above the 10-year, it can indicate an impending recession. This is not currently the case.
- Credit spreads: starting to widen but no signs of deep distress yet, in our opinion.
- Longer-Term Inflation Expectations: still below 3% across a variety of instruments.
- Earnings Revisions: revisions remain positive in the US and Europe, though to a lesser extent than in 2021; slightly negative in Emerging Markets.
- Crowd Sentiment: short-term crowd sentiment now in ‘pessimism’ territory, but not yet at the extreme levels we would normally associate with a contrarian buying opportunity.
RiverFront’s Balanced Portfolio Strategy Given This Backdrop
In last week’s trades we took some risk reduction action across our balanced asset allocation portfolios, staying consistent with a similar approach we took in mid-December. We remain overweight stocks and cash relative to bonds, given our view of the unattractive nature of bond prices at current levels. Our risk indicators remain on high alert as triggers for further potential portfolio risk management action, with a focus on our two shortest-horizon portfolios.
- In our two shorter-horizon, more risk-adverse portfolios, we reduced risk by trimming equity long-term corporate bond exposure by roughly 3.5 percentage points last week.
- In our three longer-horizon, more risk-tolerant portfolios, we reduced exposure to high-volatility US equites and international growth equities, replacing them with positions we believe will have less potential downside should the environment remain challenging.
- Across all our balanced portfolios, we also have a heightened level of cash (roughly 6-8% of portfolio) as ballast against further negative returns in both stocks and bonds.
In General, We Are:
- Emphasizing cyclical/value assets: our last few trades in the balanced portfolios have been to focus more on cyclical areas of equities such as energy.
- Bullish on covered call strategies: In 2021, we instituted and have subsequently raised our position size in covered call ETFs, in anticipation of more volatile markets (see disclosures at end for more information on covered calls).
- Focused on more specific security selection: we believe this is an environment that rewards more specific selection strategies, vs. more passive, broad exposures; this may mean more individual stocks going forward and/or more industry and geography-specific ETFs, especially in the longer-horizon portfolios.
Important Disclosure Information:
The comments above refer generally to financial markets and not RiverFront portfolios or any related performance. Opinions expressed are current as of the date shown and are subject to change. Past performance is not indicative of future results and diversification does not ensure a profit or protect against loss. All investments carry some level of risk, including loss of principal. An investment cannot be made directly in an index.
Information or data shown or used in this material was received from sources believed to be reliable, but accuracy is not guaranteed.
This report does not provide recipients with information or advice that is sufficient on which to base an investment decision. This report does not take into account the specific investment objectives, financial situation or need of any particular client and may not be suitable for all types of investors. Recipients should consider the contents of this report as a single factor in making an investment decision. Additional fundamental and other analyses would be required to make an investment decision about any individual security identified in this report.
Chartered Financial Analyst is a professional designation given by the CFA Institute (formerly AIMR) that measures the competence and integrity of financial analysts. Candidates are required to pass three levels of exams covering areas such as accounting, economics, ethics, money management and security analysis. Four years of investment/financial career experience are required before one can become a CFA charterholder. Enrollees in the program must hold a bachelor’s degree.
All charts shown for illustrative purposes only. Information or data shown or used in this material was received from sources believed to be reliable, but accuracy is not guaranteed.
Covered Call – An option is a contract sold by one party to another that gives the buyer the right, but not the obligation, to buy (call) or sell (put) a stock at an agreed upon price within a certain period or on a specific date. A covered call option involves holding a long position in a particular asset, in this case US common equities, and writing a call option on that same asset with the goal of realizing additional income from the option premium. Certain ETFs use a covered call strategy. By selling covered call options, the fund limits its opportunity to profit from an increase in the price of the underlying index above the exercise price but continues to bear the risk of a decline in the index. A liquid market may not exist for options held by the fund. While the fund receives premiums for writing the call options, the price it realizes from the exercise of an option could be substantially below the indices current market price.
30-Day Fed Funds futures and options are one of the most widely used tools for hedging short-term interest rate risk. Fed Fund futures are a direct reflection of collective marketplace insight regarding the future course of the Federal Reserve’s monetary policy. Fed Fund futures provide a gauge of market expectations about the Fed’s action at future FOMC meetings
The federal funds rate is the target interest rate set by the Federal Open Market Committee (FOMC). This is the rate at which commercial banks borrow and lend their excess reserves to each other overnight.
Stocks represent partial ownership of a corporation. If the corporation does well, its value increases, and investors share in the appreciation. However, if it goes bankrupt, or performs poorly, investors can lose their entire initial investment (i.e., the stock price can go to zero).
Bonds represent a loan made by an investor to a corporation or government. As such, the investor gets a guaranteed interest rate for a specific period of time and expects to get their original investment back at the end of that time period, along with the interest earned. Investment risk is repayment of the principal (amount invested). In the event of a bankruptcy or other corporate disruption, bonds are senior to stocks. Investors should be aware of these differences prior to investing.
In a rising interest rate environment, the value of fixed-income securities generally declines.
Technology and internet-related stocks, especially of smaller, less-seasoned companies, tend to be more volatile than the overall market.
Investing in foreign companies poses additional risks since political and economic events unique to a country or region may affect those markets and their issuers. In addition to such general international risks, the portfolio may also be exposed to currency fluctuation risks and emerging markets risks as described further below.
Changes in the value of foreign currencies compared to the U.S. dollar may affect (positively or negatively) the value of the portfolio’s investments. Such currency movements may occur separately from, and/or in response to, events that do not otherwise affect the value of the security in the issuer’s home country. Also, the value of the portfolio may be influenced by currency exchange control regulations. The currencies of emerging market countries may experience significant declines against the U.S. dollar, and devaluation may occur subsequent to investments in these currencies by the portfolio. Foreign investments, especially investments in emerging markets, can be riskier and more volatile than investments in the U.S. and are considered speculative and subject to heightened risks in addition to the general risks of investing in non-U.S. securities. Also, inflation and rapid fluctuations in inflation rates have had, and may continue to have, negative effects on the economies and securities markets of certain emerging market countries.
Standard & Poor’s (S&P) 500 Index TR USD (Large Cap) measures the performance of 500 large cap stocks, which together represent about 80% of the total US equities market.
The Consumer Price Index (CPI) is a measure that examines the weighted average of prices of a basket of consumer goods and services, such as transportation, food, and medical care. It is calculated by taking price changes for each item in the predetermined basket of goods and averaging them. Changes in the CPI are used to assess price changes associated with the cost of living. The CPI is one of the most frequently used statistics for identifying periods of inflation or deflation.
The Baltic Dry Index (BDI) is a shipping and trade index created by the London-based Baltic Exchange. It measures changes in the cost of transporting various raw materials, such as coal and steel.
When referring to being “overweight” or “underweight” relative to a market or asset class, RiverFront is referring to our current portfolios’ weightings compared to the composite benchmarks for each portfolio. Asset class weighting discussion refers to our Advantage portfolios. For more information on our other portfolios, please visit www.riverfrontig.com or contact your Financial Advisor.
RiverFront Investment Group, LLC (“RiverFront”), is a registered investment adviser with the Securities and Exchange Commission. Registration as an investment adviser does not imply any level of skill or expertise. Any discussion of specific securities is provided for informational purposes only and should not be deemed as investment advice or a recommendation to buy or sell any individual security mentioned. RiverFront is affiliated with Robert W. Baird & Co. Incorporated (“Baird”), member FINRA/SIPC, from its minority ownership interest in RiverFront. RiverFront is owned primarily by its employees through RiverFront Investment Holding Group, LLC, the holding company for RiverFront. Baird Financial Corporation (BFC) is a minority owner of RiverFront Investment Holding Group, LLC and therefore an indirect owner of RiverFront. BFC is the parent company of Robert W. Baird & Co. Incorporated, a registered broker/dealer and investment adviser.
To review other risks and more information about RiverFront, please visit the website at www.riverfrontig.com and the Form ADV, Part 2A. Copyright ©2022 RiverFront Investment Group. All Rights Reserved. ID 2015890
