
Just two weeks ago, the news media was talking about one of the worst weeks in market history. Now, we are hearing that this past week has been one of the best of all time.
A parabolic drop in the market could be compared to the stretching of a rubber band. The further the band stretches, the faster and harder the “snap back.” Sharp emotional drops bring sharp emotional advances. The worst market periods are often followed by some of the best, and vice versa.
The S&P 500 took only 23 days to drop by more than 30%. The “snapback” rebound only required 13 days to retrace half of the total decline. Both, the timing and magnitude of the recent market action defies logic. In fact, Wall Street’s most used measurements of volatility risk, standard deviation, would deem the last 30 plus trading days to be statistically impossible to occur, but they did.
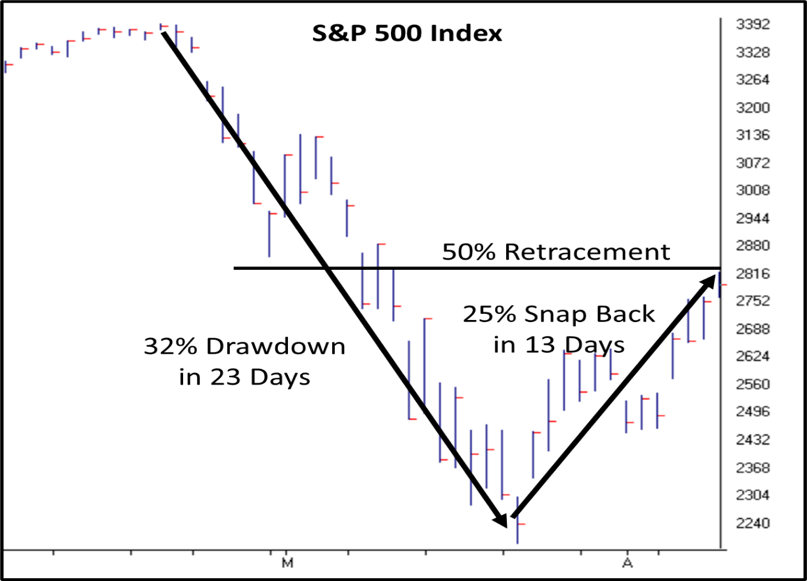
Source: AIQ Trading Expert Pro
So, what led to the recent rally? Could it have been changes in the short-term news? In fact, high impact/low probability events, can make investors emotional and cause them to overreact, in both directions. Some of the biggest down days were surprisingly preceded by good news. On the other hand, the big up days also occurred when most would least expect. Emotional markets will tend to react in a counterintuitive way from what investors would expect.
What segments of the market benefited the most from the recent run up? As the old saying goes, every dog has its day. Again, emotional markets tend to be counterintuitive.
Many times, we see that the asset classes that were hit the worst will follow with a big short-term advance. This was the case during the most recent rally. The S&P sectors that were hit the hardest, also had the largest rebounds. Check out the table below:
| Largest Drawdown | Largest Kickback | Smallest Percent off February High | |
| 1 | Energy | Energy | Healthcare |
| 2 | Financials | Real Estate | Staples |
| 3 | Industrials | Utilities | Utilities |
| 4 | Real Estate | Materials | Real Estate |
| 5 | Materials | Financials | Materials |
| 6 | Utilities | Industrials | Technology |
| 7 | Discretionary | Healthcare | Communications |
| 8 | Technology | Discretionary | Discretionary |
| 9 | Communications | Technology | Industrials |
| 10 | Healthcare | Staples | Financials |
| 11 | Staples | Communications | Energy |
Notice that the previous 6 worst performing sectors followed with the largest kickback rallies. Similarly, the 5 sectors that had declined the least, also had smaller rallies.
The last column ranks the sectors based on how far each is down from its February high. The sector in the #1 spot would be the closest to its previous high. Keep in mind that money is only made when the security, or the portfolio, puts in a new high in value. It is interesting to point out, that with a few exceptions, the sectors that experienced the smallest initial drawdowns and smallest kickbacks, were the closest to returning to their old highs.
This is an excellent example of a phenomenon we have discussed many times before. The magic of geometric compounding of returns. Compounding is enhanced when a security’s percentage decline, and the following rebound is smaller. As opposed to a large decline coupled with a large rebound. In other words, when a security’s value declines less, then the benefit of compounding is enhanced when it rebounds off a larger base value.
The table above shows that the sectors that experienced larger kickback rallies, also experienced larger drawdowns. As a result, these sectors rebounded off a smaller dollar base. The larger drawdown negatively impacted the benefit of the rally that followed, and thus damaged the ability to compound returns.
That said, it is important to note that the amount of decline is less important than the amount of “time” that it takes to establish a new high in value. Compounding returns is enhanced when the amount of time, between the old and new high in value, is short.
Short-Term Outlook:
The markets are still highly volatile. Investors have become accustomed to experiencing wide-ranging days. Just two months ago, seeing a +/-2% move would have been a huge day. Now, a 2% day feels like a reprieve from the crazy volatility we have been experiencing. The current high volatility will require a period of time to regain its footing as the markets begin to restore a sense of rationality.
So far, we saw the markets drop sharply, followed by an equally sharp rally. It would be possible for the markets to continue to rally from here, without taking a breather. That said, a meaningful short-term continuation up from here is unlikely.
Our video updates have repeatedly emphasized that a 50% retracement of the total decline was expected. Even though such a rally sounded like an almost impossibility at the time. We said: “Expect The rally will come when the majority would least expect.” “The advance would come fast and if you are not already in, then you will not have time to get in.” That is exactly what happened. This is another example of the counterintuitive nature of emotional markets.
Here is the two-minute video summary that Canterbury produced on March 23rd (the day of the most recent market bottom):
Adaptive Portfolio Management – Navigating the Current Market
Volatile markets are all about money management. A key rule in Adaptive Portfolio Management is to not make changes in the portfolio that could cause the possibility of a “whipsaw.” We cannot make changes that would substantially reduce exposure to the market, following an emotional decline, and risk having less money invested when the inevitable rebound occurs. For example, a decision to get out, or to substantially reduce holdings, following a decline, will make the losses real. Missing out on the following rally can cause substantial damage to the portfolio.
The first drop came off a new high (2/19/2020) and had extremely low volatility. A normal “pullback” (-5%) or “correction” (-10%) would have been expected. A -30% plus decline, over 22 days, was not only unlikely but is unprecedented in the history of the U.S. equity markets. That said, adaptive portfolio management has rules that must be followed, even when an unexpected trading anomaly occurs.
It was crucial, for the portfolio to have about the same amount of market exposure, during the first kickback rally, as it had during the decline. This would avoid the potential for getting whipsawed (meaning having more exposure on the way down and less on the way back up). We were able to make small adjustments in the holdings during the decline and the first part of the initial rally, to upgrade the overall positioning. As we began to see that kickback, there were opportunities to make more substantial adjustments.
The adaptive portfolio strategy utilizes the use of “inverse” Exchange Traded Funds (ETFs). We were able to establish the appropriate inverse holdings during last week’s rally. Inverse ETFs move in the opposite direction of the underlying index. Currently we own the Inverse Large Cap. International stock index, Inverse Real Estate, and Inverse Small Cap US stock ETFs. These ETFs go up when the equivalent market indexes goes down.
These holdings help mitigate the risk of a declining market. We will begin to remove some of the inverse ETFs at lower levels. This creates the opportunity to benefit from the market’s fluctuations.
Adding to, and subtracting from, the inverse ETFs will serve to adjust equity exposure as the markets begin to fluctuate, both up and down. By lowering exposure on the downside and increasing it on the upside during this type of volatile environment, enhances the ability to compound returns over time. This is one of the ways the Canterbury Portfolio Thermostat aims to navigate, and benefit from, the current environment.
Keep an eye out during the next few days for a Canterbury video that further explains this concept.
