
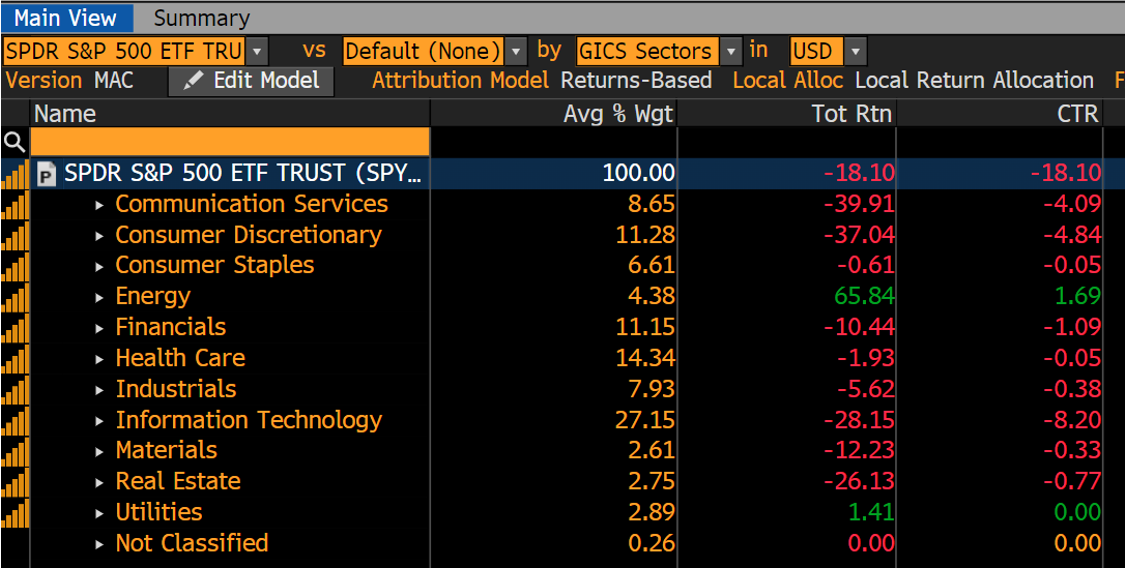
Energy Will Lead to Significant Portfolio Dispersions
The impact of inflation on 2022 portfolio returns led many investors to pile into energy stocks, which contributed a positive 65.84% return on a 2.7% weighting because of the sector’s positive alignments with inflation and earnings growth. According to Bloomberg, this means that it contributed 1.69% in return over a 18.10% loss. Clearly, with no other sector providing a positive return, we can call that alpha! By year end 2022, energy was 5.28%, so while a modest exposure made a meaningful difference for investors in 2022, we believe the sector will have even greater impact in 2023. As a reminder, as of December 31, 2021, according to the S&P Global Indices, an estimated $15.6 trillion was indexed or benchmarked to the S&P 500 index, with about $7.1 trillion in the form of passive funds. All this follows a question from a financial advisor that we received last week.
Energy Exposure
Questions from financial advisors make our days fun at the ETF Think Tank, and this week we were asked: “How can it be that the iShares Growth ETF (IWO) which tracks the Russell 2,000 Growth index has a 6-7% weighting in energy? Isn’t energy a value play?”
Answer: Part One – Differences in Large Cap Integrated Energy Companies
Renewables and alternatives make up the energy category, and yes, Chevron and Exxon are involved in energy alternatives and renewables, despite being mostly known as traditional integrated energy producers. In retrospect this may be obvious, but way too often we think about large companies in simple style box categories. Also, let’s not forget that how a company spends shareholder dollars can amount to future growth prospects, or at least, it is expected to. Barron’s highlighted the complexity of this issue when Brian Swint wrote “BP and Shell vs Exxon and Chevron: the Mystery of Big Oil’s P/E Gap.” Sometimes there is a reason for the cheapness of a stock. As Brian writes, “last year, global oil companies boomed. BP and Shell both based in London, saw share prices rise some 40% in 2022, and trade at five times forward earnings. U.S.-based Exxon Mobil soared nearly 80% and trades at almost 10 times earnings, while Chevron rose 50% and trades at 11 times.”
Swint continues with, “why that gap? Many blame windfall-profit taxes. All the oil giants feasted on rising oil prices after Russia invaded Ukraine. While prices have fallen, they’re still at levels that produce sizable profits. However, European governments are clawing back some of those gains by taxing oil producers to subsidize high energy costs for consumers.” We would also note that Exxon continues to show progress with its spending (read about that here.)
Answer: Part Two – How is Energy Addressed Across Factors
Chart 1: Vastly Different Outcomes Despite IWO and IWN Using the Russell 1000 Index

Chart 2: ETF Think Tank Provides Fund Volatility and Attribution Analysis for Funds

The iShares Russell 2000 Growth ETF (IWO) and iShares Russell 2000 Value ETF (IWN) both hold between 6 and 7% in energy. While the different performance-driving factors will likely lead to performance differences in 2023, the characterization of breaking down the sector as energy is overly simple. Sectors and the conditions that effect the various business models and company opportunities within an industry make for dissimilar outcomes themselves. Also, even when the index methodology and universe is the same, as is the case with the iShares passive ETFs, the outcome is going to lead to significant differences for investors. This is the point of factor investing, but not everyone agrees with the definition of such factors, which can lead to significant dispersion of returns around the same factors. For example, we highlight two large-cap value ETFs – how can it be that there is so little overlap? This is also the case for Distillate US Fundamental Stability & Value ETF (DSTL) and Pacer US Cash Cows 100 ETF (COWZ). This shows that cash flow is at the core of the methodology.
Chart 3: Dispersion of Performance (DSTL vs COWZ)
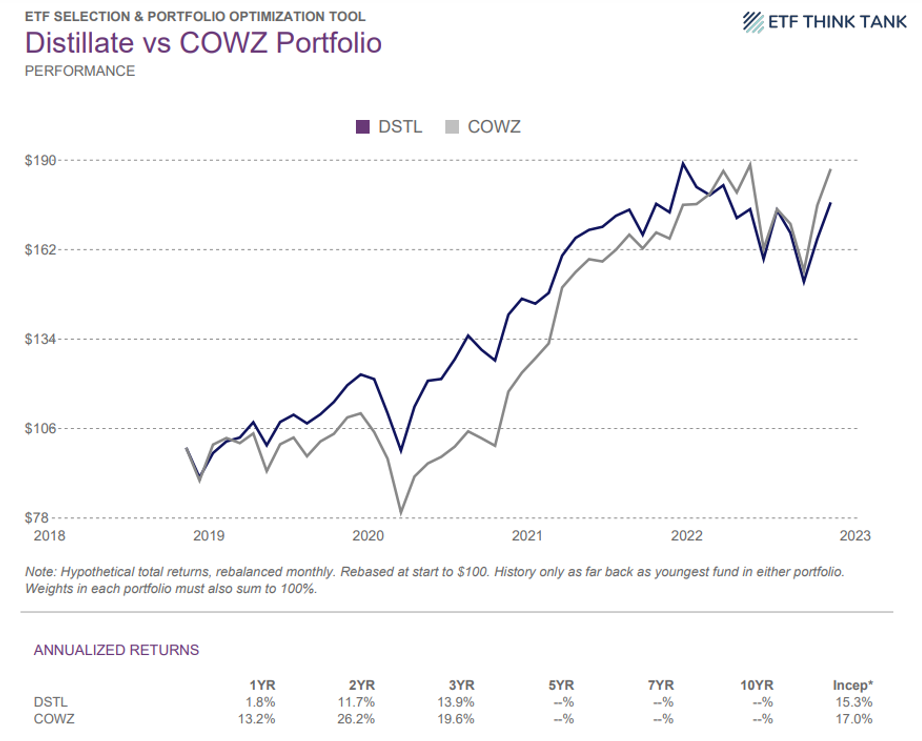
Chart 4: ETF Think Tank Overlap Analysis DSTL vs COWZ (14%)

Chart 5: DSTL vs COWZ Market Cap Comparison

Chart 6: DSTL vs COWZ Highlights Energy Overweighting By COWZ

Chart 7: ETF ThinK Tank Tool Performance Data DSTL VS Broad Group

Summary
Financial advisors and investors need to have an opinion on energy exposure in their portfolio, whether they are strategic allocators or tactical strategists, and whether the focus is on value, growth, or combination of factor ingredients. While energy is the focus of this report, investors need to look under the hood and identify which themes might drive broad indexes in 2023. We often focus on the disconnect between historical returns and current conditions. While the financial advisor’s question that warranted this blog was simple, it led to the larger question about inflation and recession in 2023. To this point, we think the outperformance of this group should be isolated and tracked in a portfolio on a regular basis rather than buried across multiple funds. The sector, like many, is very complex. Ultimately, these changes are an example of why investors need to have an active process to manage portfolios effectively. Don’t let complacency drive portfolio returns! That environment is in the past!
We hope readers find the Tank Tools helpful. Please keep the questions coming.
Best,
Dan
Energy Vanguard prospectus https://fund-docs.vanguard.com/viccf-annual-report.pdf
https://www.spglobal.com/spdji/en/commentary/article/us-equities-market-attributes
Disclosures
All investments involve risk, including possible loss of principal.
This material is provided for informational purposes only and should not be considered an individualized recommendation or personalized investment advice. The investment strategies mentioned may not be suitable for everyone. Each investor needs to review an investment strategy for his or her own particular situation before making any investment decision.
All expressions of opinion are subject to change without notice in reaction to shifting market conditions. Data contained herein from third party providers is obtained from what are considered reliable sources. However, its accuracy, completeness or reliability cannot be guaranteed.
Examples provided are for illustrative purposes only and not intended to be reflective of results you can expect to achieve.
The value of investments and the income from them can go down as well as up and investors may not get back the amounts originally invested, and can be affected by changes in interest rates, in exchange rates, general market conditions, political, social and economic developments and other variable factors. Investment involves risks including but not limited to, possible delays in payments and loss of income or capital. Neither Toroso nor any of its affiliates guarantees any rate of return or the return of capital invested. This commentary material is available for informational purposes only and nothing herein constitutes an offer to sell or a solicitation of an offer to buy any security and nothing herein should be construed as such. All investment strategies and investments involve risk of loss, including the possible loss of all amounts invested, and nothing herein should be construed as a guarantee of any specific outcome or profit. While we have gathered the information presented herein from sources that we believe to be reliable, we cannot guarantee the accuracy or completeness of the information presented and the information presented should not be relied upon as such. Any opinions expressed herein are our opinions and are current only as of the date of distribution, and are subject to change without notice. We disclaim any obligation to provide revised opinions in the event of changed circumstances.
The information in this material is confidential and proprietary and may not be used other than by the intended user. Neither Toroso or its affiliates or any of their officers or employees of Toroso accepts any liability whatsoever for any loss arising from any use of this material or its contents. This material may not be reproduced, distributed or published without prior written permission from Toroso. Distribution of this material may be restricted in certain jurisdictions. Any persons coming into possession of this material should seek advice for details of and observe such restrictions (if any).
