
The S&P 500 hit an all-time high on February 19th, reaching 3,386, before the emergence in the US of the COVID-19 virus triggered a swift one-month -34% collapse. A bottom was put in on March 23rd, and the large cap index proceeded to rally nearly +32% over the next 30 days. As I write, the S&P 500 is down about -6.0% for 2020, despite a US economy that is struggling to emerge from the mandated shutdown and is facing a long arduous path to regain some semblance of “normalcy”.
Despite a horrific string of economic numbers, including a 13.3% Unemployment Rate in May and an estimated –46% decline in second quarter US GDP per the Atlanta Fed GDPNow model, the S&P 500 index has a +6.4% total return on a trailing 1-year basis. How is that possible? Looking beyond the $7.5 trillion Federal Reserve balance sheet and the 20% of GDP fiscal injection from Congress, the broader large cap S&P 500 index is concealing an inconvenient truth: many stocks remain mired in a longer-term bear market.
To recap, the S&P 500 is a market-cap weighted index, meaning stocks are weighted according to their current stock market value. Currently, just 5 companies make up over 21% of the index: Microsoft, Apple, Amazon, Facebook and Google (MAAFG). The balance of the index is comprised of 490+ stocks, many of which are telling a different story. Over the past 1-year thru June 25th, the aforementioned 5 stocks were up an average of 43% while the remainder of the index was down -6%. If we were to look at the S&P 500 on an equal-weighted basis, where all the index members contributed the same amount towards the return, we would see the “average” stock in the S&P 500 was down -5% over the past 12 months.
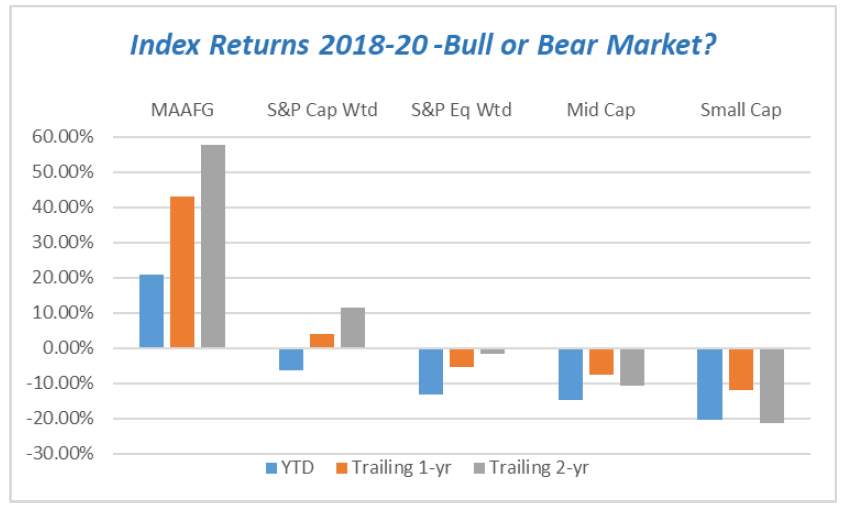
Beyond the inconsistent returns within the S&P 500, if we move down the market cap spectrum to mid and small cap equities, we find trailing 1-year declines of -7.6% and -12% respectively. Year to date, the S&P 400 mid-cap index is down -15% while the S&P 600 small-cap index is down -21%. A summary table is offered below and in graphical form further down the page.
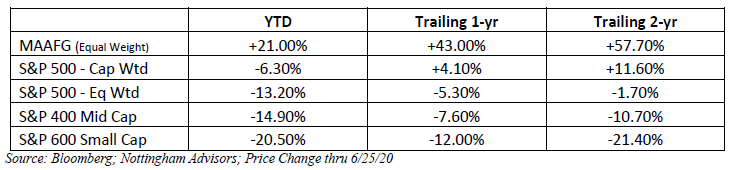
Despite the ‘bull” market for tech stocks, especially MAAFG, one could argue that small and possibly mid-caps are deep into year 2 of a bear market, and when looking at the average stock in the S&P 500, many US large cap stocks have done little more than tread water for the past few years.
The puzzling performance of US equities is even more pronounced when one considers Growth versus Value. Pity the poor value manager that is struggling through nearly 10 years of underperformance relative to their “growth” counterparts.
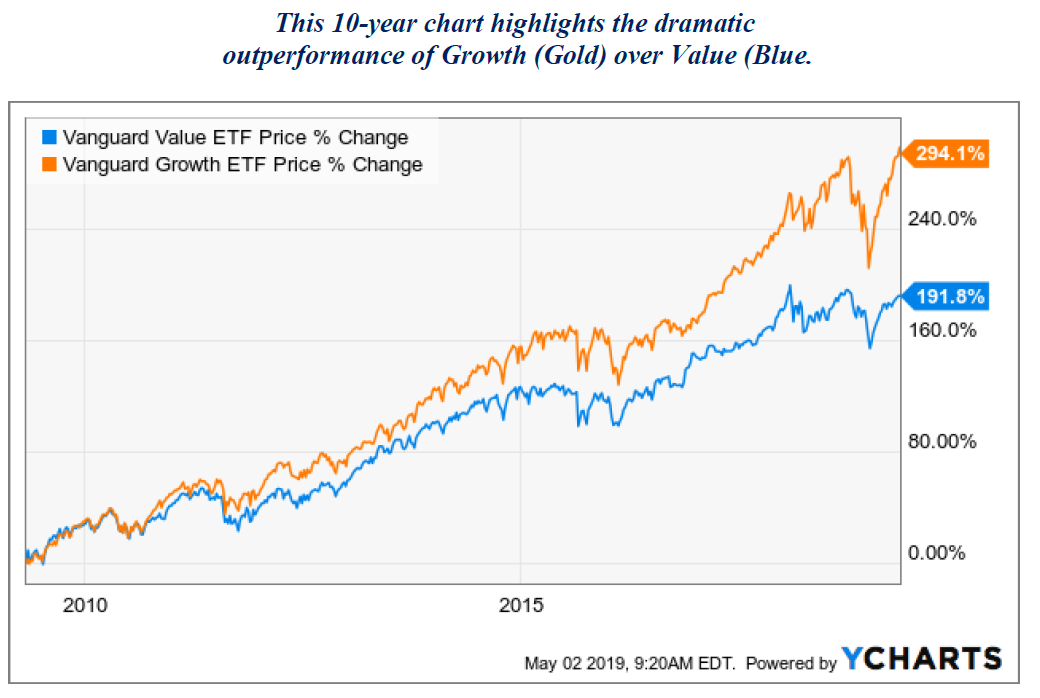
Recall from earlier that MAAFG now makes up over 21% of the cap-weighted S&P 500 index. When it comes to the S&P 500 Growth Index, these five companies comprise over 36% of the holdings. The outsized impact this narrow band of companies is having on broader indices is leading many investors to mistakenly extrapolate a narrow set of investment returns across a much broader opportunity set. In other words, the “market” isn’t doing nearly as well as the S&P 500 index would seem to indicate.
Certainly the economic shutdown triggered by the COVID-19 pandemic played to many of the strengths of these giants, whether it be socially-distant connecting enabled by Facebook, home delivery of virtually anything via Amazon, or web-based video meeting services enabled by Microsoft. It doesn’t hurt that they are all well-run, have formidable balance sheets and don’t require a lot of capital to operate. But as a proxy for the overall US market, they fall short.
Yet an investment portfolio today that doesn’t have at least an equivalent “market cap exposure” to these companies is likely to lag when compared to the broader US indices. Much as they did in the halcyon days of the late ‘90’s, fast-growing but expensive technology companies can severely skew the investment landscape. This time may be similar, although perhaps not to the extreme of 1999.
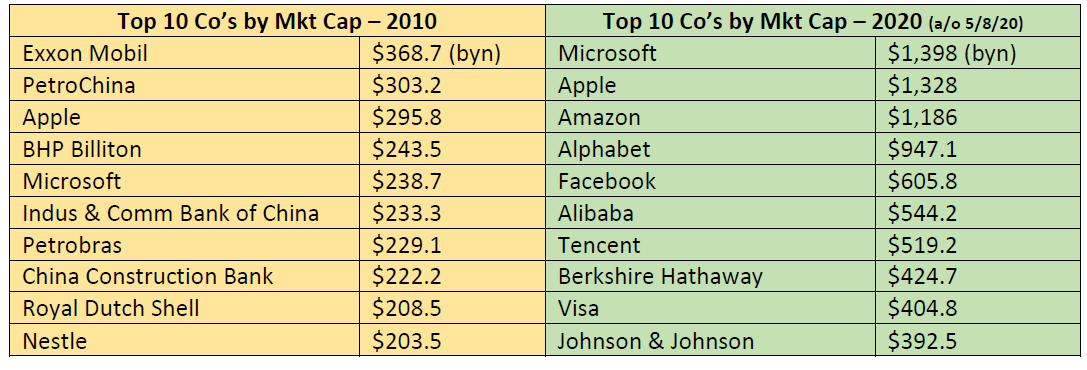
Even looking over the past decade, a significant shift has occurred in market leadership. During the ought’s, Financials, Energy and China dominated the most valuable company rankings. Fast forward ten years and the list is dominated by Technology companies, primarily US tech.
Market leadership today has rarely been this narrow, with the gap between the leaders and laggards continuing to widen. As adherents to the idea of mean reversion, Nottingham often will look to swim against the tide. This can be challenging – and rarely ever more so than now. The international, domestic SMID cap, and Value components of our portfolio have lagged US growth considerably. Many pundits have given up the sectors for dead. Certainly it’s more comfortable to hide out in the crowded Tech trade.
The good news for our clients is that Nottingham continually monitors the underlying holdings that comprise the exchange-traded funds used in our models. And, while our equity allocations all have exposure to the MAAFG quintet, Nottingham’s portfolio managers are able to tweak the overall impact of that grouping by diversifying across sector, region, factor and cap scale in order to balance out, or mitigate the potential for overly-concentrated holdings.
For example, outside of the S&P 500 Value and Growth allocations, our next biggest holding in the US large-cap box is USMV, the iShares Edge MSCI Minimum Volatility USA ETF. Of the MAAFG companies, only Microsoft appears in the top 20 holdings of this index fund. So while it can be frustrating as an asset manager to deliberately favor prudence over trend following and lag the benchmark a bit at times, Nottingham Advisors has been at this long enough to know that trees don’t grow to the sky and that the stock which is a “must-own” today, may be the victim of extreme sentiment change 6 months hence.
Our analysis tells us that diversification usually works well over the long run, but occasionally it can appear a hindrance over shorter periods of time. Buying stocks at excessive multiples of earnings rarely works well over time, with studies showing a distinct negative correlation between the price you pay today and the subsequent return over the next 5-10 years. Rest assured our goal is to balance return-seeking with risk management over a long period of time. That’s our commitment to our clients and one that we hope stays in vogue for decades to come.
Have a safe and healthy summer,
Larry Whistler, CFA
President/Chief Investment Officer
June 2020
