
By Bob Smith, Sage Advisory President
Nowhere to run to baby, nowhere to hide
I got nowhere to run to baby, nowhere to hide
Song by Martha & the Vandellas, 1965
The first couple lines of the iconic 1960s song “Nowhere to Run” best describes the difficult atmosphere of the bond markets in the first half of this year. Indeed, as illustrated below, the market beatdown affected every major sector of the bond market and brought returns across the board to historic lows for this year and the last several years. The primary reason for the historic drawdown was the Federal Open Market Committee’s (FOMC) adoption of a significantly tighter monetary policy in response to raging domestic inflation, which signaled multiple short-term rate increases.
Historical Performance Review
Source: Sage, Bloomberg

*Annualized for 3, 5, 10-year periods
What was notable about the recent selloff was that the U.S. bond market has had positive returns, before inflation, in all but four years since 1976. Indeed, even in 1994 when the Federal Reserve raised interest rates six times for a total of 2.5%, the Aggregate Bond Index lost only 3%. According to the asset return research of Professor Emeritus of Business Edward McQuarrie of Santa Clara University, the losses sustained by the bond market thus far this year surpassed the 17% losses realized for the 12 months ending in March 1980. Moreover, the losses thus far in 2022 are worse than any complete year since 1792 except for 1842 when the U.S. suffered a deep economic depression.
First half performance for fixed income was particularly difficult for investors because the secular trend for interest rates since 1981 has been down with a concurrent rise in bond prices, which created a long-term tailwind of capital gains. The recent travails of the bond market are even more startling when one considers that in the late summer of 2020, during the first year of the pandemic, the 10-year U.S. Treasury yield of 0.52% reached what may have been the end of the 40-year bull market in bonds that started in in 1981, with yields at 15.8% and the CPI hitting 14.8%.
These adverse market adjustments have also reflected general investor sentiment about the direction of the economy and, in particular, the direction and level of inflation across a wide range of indicators that have remained at levels not anticipated by either the Federal Reserve or the Administration. Investors sensed that these tough economic conditions were more than “transitory” in nature and, as shown below, began to reduce their exposure to fixed income mutual funds and ETFs in earnest.
Monthly Net Flows for Bond Mutual Funds
Source: Investment Company Institute (ICI), Morningstar Research

The fixed income fund withdrawals and ETF liquidations have gone on for seven straight months, the longest consecutive monthly net withdrawal streak on record, equaling more than 2% of total taxable bond fund assets at the end of 2021. Municipal withdrawals for this period were even more dramatic, totaling more than 6% of total municipal bond fund assets at the end of 2021.
Fixed Income Flows
Source: Bloomberg Finance, L.P., State Street Global Advisors, as of June 30, 2022

Thus far this year the investment grade and high yield credit sectors have suffered the brunt of the investor withdrawals or liquidations, contributing to reduced market liquidity and concurrent yield spread widening. These trends are clearly indicated in the chart above. Interestingly, despite the rising rate environment, investor flows have remained positive for U.S. government-focused funds, with the bulk of those positive flows going into short-term investment strategies in anticipation of higher interest rates and a further weakening of the economic environment.
Bond vs Stocks: Our Relative Value Outlook
This has been a painful transition for most bond market participants, but it should be no surprise to anyone that near zero interest rates of the last few years were not sustainable. We are confident that we will see further rate hikes, higher inflation, unresolved geopolitical conflicts, and waning growth over the balance of the year. Moreover, the coming U.S. mid-term elections will only add to the concerns of the market and promote further volatility challenges for investors.
To be sure, the low interest rate conditions that favored the TINA (there is no alternative) advocates and stocks have now dissipated. The FOMC’s aggressive policy pivot has caused yields to move higher than they have been in a decade, and as a result, there are plenty of interesting alternatives to be found in the current rubble of the fixed income markets.
It is worth noting that the current 10-year Treasury yield of around 3% is now about 160 basis points higher than the 1.4% dividend yield of the S&P 500 index. This is compressed compared to the long-term average of about 300 basis points. Any near-term widening in this spread due to higher bond yields will decrease the relative attractiveness of stocks and increase the appeal of fixed-income assets, which may in turn continue to place further downside pressure on stocks. Eventually this becomes self-corrective with the further sell-off of stocks and rising dividend yields. We believe this may occur later in the year, but for the moment, this spread trend favors fixed income investments.
We note that while the price/earnings multiple valuation for the S&P 500 Index has ratcheted down from 37x a year ago to the current 20x, the balance of this year will likely see further valuation reductions to about 16x, owing to softer corporate earnings reports, more cautious management forward guidance, higher capital costs, and the continuation of a high inflation/low growth global economic environment.
S&P 500 Yields vs 10 Year Yield: Since 1962
Source: Seeking Alpha
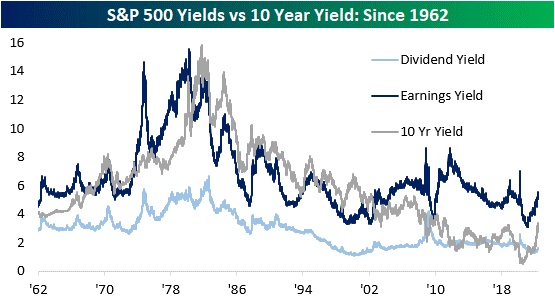
A review of the earnings yield of the S&P 500 versus the 10-year Treasury yield indicates that fixed income investments may have a way to go versus the relative attractiveness of stocks. The earnings yield (the inverse of the P/E ratio) is currently 220 basis points higher than the 10-year Treasury yield. If this spread were to turn negative, it would imply that risk-free assets like Treasuries would be generating superior earnings compared to equities. Now, the S&P 500 earnings yield is above the 10-year Treasury yield, suggesting that stocks still appear attractive in absolute terms. However, we believe that with the coming quarter’s less sanguine earnings reports, equity valuations may come under further pressure. This would lead to a narrowing in this valuation spread and a greater appeal for lower-risk, high-quality fixed income investments.
Over the long run the total return of bonds depends far more on their income generation compared to short run changes in price. Investors are wise to remember that since 1976 well over 90% of the total return of the U.S. Aggregate Bond Index came from interest income and the reinvestment of that income over time. It has been said that people always chase the past with their money. We saw this in 2020 when investors chased the higher total returns of fixed income and ended up pouring close to $450 billion into bond funds as yields fell to 1%. According to recent history, those investment actions appear to have been overly optimistic.
The same might be said about the extraordinarily elevated level of pessimism investors have shown by their aggressive fixed income fund withdrawals and ETF liquidations thus far this year. We would argue that with the recent immense decline in bond prices and the comparatively attractive starting yields, investors now have more cushion to absorb the incremental increases in short-term rates that may yet be introduced by the FOMC. These expected policy actions have been priced into the current bond valuations and with those price adjustments we are beginning to see some value emerge across the yield curve and between the various sectors of the market, particularly at the front end of the yield curve.
Trends and Risks We are Following
The FOMC intends to maintain a balanced interest rate policy aimed at reducing inflation to a more manageable level while working to limit the potential slowdown in the rate of growth of the economy, aka the “soft landing” scenario. As noble as that goal may be, given the current global economic slowdown, the ongoing supply chain imbalances that continue to erode consumer and business confidence, and the expected tightening of liquidity that will arise from the Federal Reserve Bank’s (FRB) balance sheet reductions, we are looking for a moderate stagflation environment that may persist until the end of 2023.
Given this environment we anticipate 10-year Treasury bond yields to move between 3% to 3.5% for the balance of this year and begin to decline by the second half of 2023. We also anticipate that market volatility will remain in high gear with the markets testing the ranges regularly in reaction to short-term geopolitical or FRB/government policy stimuli. In the absence of any further unknown external geopolitical shocks, we believe inflationary trends will slowly begin to recede as economic activity cools off from the FOMC’s policy actions. As a result, interest rates will be a bit higher but should be manageable for most consumers and businesses.
The current U.S. employment outlook remains constructive and will be so for the balance of this year. This has allowed the underlying growth in the economy to remain marginally positive, notwithstanding the dour Atlanta Federal Reserve GDP projections for the second quarter. While consumers have pared back their consumption activities and increased their dependency on credit in recent months in reaction to this year’s burst of inflationary cost pressures, their balance sheets overall remain strong. This has also been true for businesses, which should mean that delinquencies and defaults will hopefully remain low.
We believe that investors will begin to return to the bond market over the remainder of the summer after the next 75-basis-point federal funds rate increase has been introduced this month. There may be more rate increases ahead, but in our view the FRB would be well advised to take a market intervention break until well after their late August Economic Symposium in Jackson Hole. In the meantime, we believe investors should be focused on identifying companies with durable cash flow metrics, dominant market positions, and solid balance sheets across a range of market sectors, with a particular focus on investing in medium quality-rated credits that have been overly discounted in the recent sell-off.
Lastly, we believe investors need to keep sight of what the late Donald Rumsfeld referred to as the “known unknowns.” First, the Russia/Ukraine conflict continues to rage on, and it could be our No. 1 joker in the deck in terms of potential adverse or positive market impacts depending how these hostilities play out. Stay tuned.
Second, new COVID-19 variant outbreaks around the globe persist, particularly in China. Government policies toward containment of these infections remain fluid but may become more restrictive as infection statistics rise and summer in the Northern Hemisphere ends. China’s current “no tolerance” policy has kept global economic activity at bay and has prevented a much greater increase in inflationary pressures than might have otherwise been realized by most other developed economies. How long this remains to be the case will be an important determinant for markets in the months ahead.
Third, the FRB’s efforts to contain supply side-driven inflationary trends with aggressive monetary policy fail to contain the rise in consumer inflation measures and cause negative reactions across the capital markets and asset values. This could be compounded by a policy whipsaw where the central banks in their frustration accelerate the removal of their past accommodation and thereby further undermine the intended global expansion.
Sources
Bartolini, Matthew. The Endless Summer… of Volatility? State Street Global Advisors SPDR. June 30, 2022.
Bespoke Investment Group. S&P 500 Yields Vs. 10-Year. Seeking Alpha. June 13, 2022.
Zweig, Jason. It’s the Worst Bond Market Since 1842. That’s the Good News. The Wall Street Journal. May 6, 2022.
Disclosures: This is for informational purposes only and is not intended as investment advice or an offer or solicitation with respect to the purchase or sale of any security, strategy or investment product. Although the statements of fact, information, charts, analysis and data in this report have been obtained from, and are based upon, sources Sage believes to be reliable, we do not guarantee their accuracy, and the underlying information, data, figures and publicly available information has not been verified or audited for accuracy or completeness by Sage. Additionally, we do not represent that the information, data, analysis and charts are accurate or complete, and as such should not be relied upon as such. All results included in this report constitute Sage’s opinions as of the date of this report and are subject to change without notice due to various factors, such as market conditions. Investors should make their own decisions on investment strategies based on their specific investment objectives and financial circumstances. All investments contain risk and may lose value. Past performance is not a guarantee of future results.
Sage Advisory Services, Ltd. Co. is a registered investment adviser that provides investment management services for a variety of institutions and high net worth individuals. For additional information on Sage and its investment management services, please view our web site at www.sageadvisory.com, or refer to our Form ADV, which is available upon request by calling 512.327.5530.
