
SUMMARY
The current conditions on Wall Street seem to be channeling Clint Eastwood’s famous film, The Good, the Bad and the Ugly. The Day Hagan/Ned Davis Research Smart Sector with Catastrophic Stop Loss Strategy may complement current allocations. Please reach out for details.
THE UGLY
The Tampa Bay Buccaneers opened their NFL season last week against the Dallas Cowboys. After watching the game, I flashed back to my youth and Clint Eastwood’s classic 1966 movie, The Good, the Bad and the Ugly. Relative to the football game, the Buccaneer win and Brady’s play was the “Good.” The Dallas Cowboys’ field goal/extra point kicker was the “Ugly.” The Buccaneers’ secondary was the “Bad.”
The movie’s title reflects the equity market’s tape action last week, too. I had previously highlighted some short-term improvements. Each time, however, I stressed that the improvements were short term and they needed to continue. Needless to say, the improvements didn’t continue last week—Tables 1 and 2.
Table 1: One-week tape action across all capitalization sizes was ugly, as shown below.
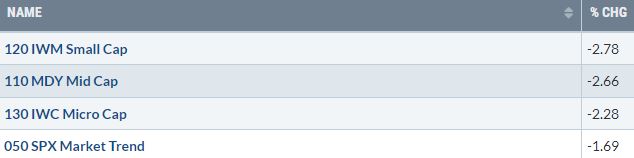
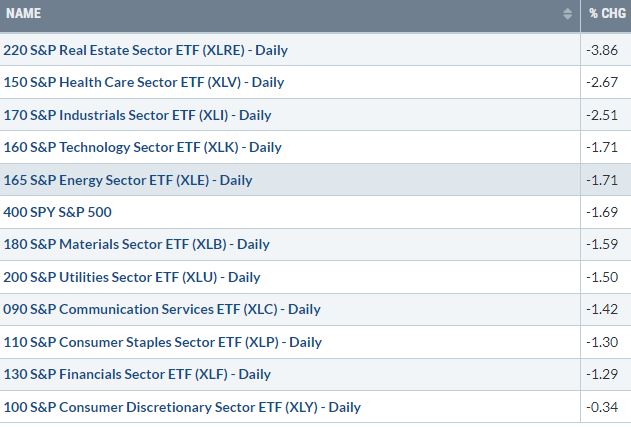
Table 2: While there wasn’t a common theme in terms of which types of sectors led and lagged (risk-on/off, cyclical value/growth), one-week sector performance was nonetheless ugly, as shown below.
THE BAD
While highlighting short-term improvements, I also stressed that they were occurring within the context of:
- Negative divergences by the NYSE Advance-Decline Lines (all-issues & Common Stock Only).
- A historically volatile period for equities (price movement both down and up), specifically in September and at times into mid-October.
These two points haven’t changed and still exist—Figures 1 and 2.
Figure 1: While the all-issues NYSE A/D Line is not far from recording a new all-time high (middle frame) the NYSE Common Stock Only A/D Line (bottom frame) has work to do. If they confirm further price highs by the NYSE Index, it would be bullish. If they fail to confirm, it would be very bearish. Monitor both closely.
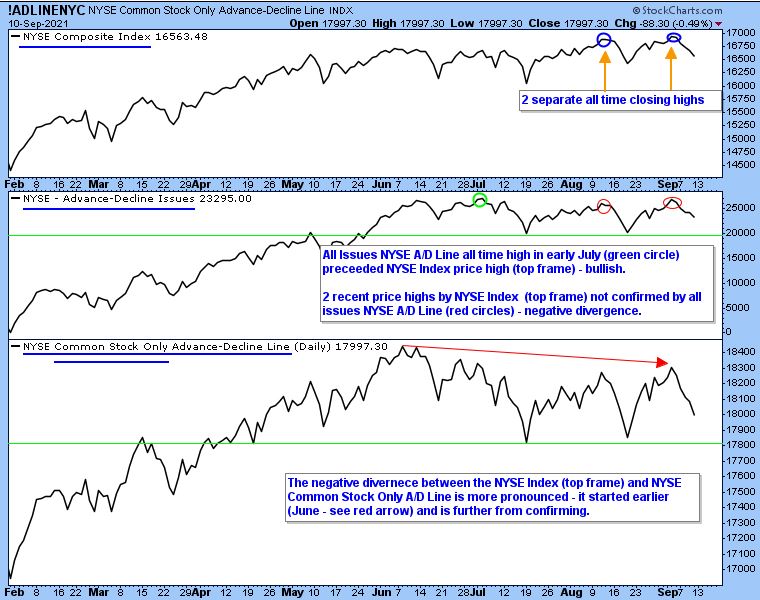
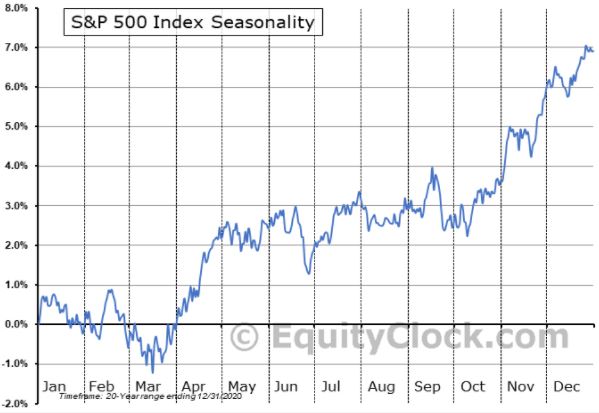
Figure 2: September is the final month of the third quarter, which leaves it susceptible to selling by mutual funds and historically one of the weaker months of the year. According to Jeff Hirsch of the excellent Stock Trader’s Almanac, “Over the last 21 years, September has generally opened tepidly with mixed performance… after mid-month any gains have tended to fade quickly and turn into losses by month’s end.”
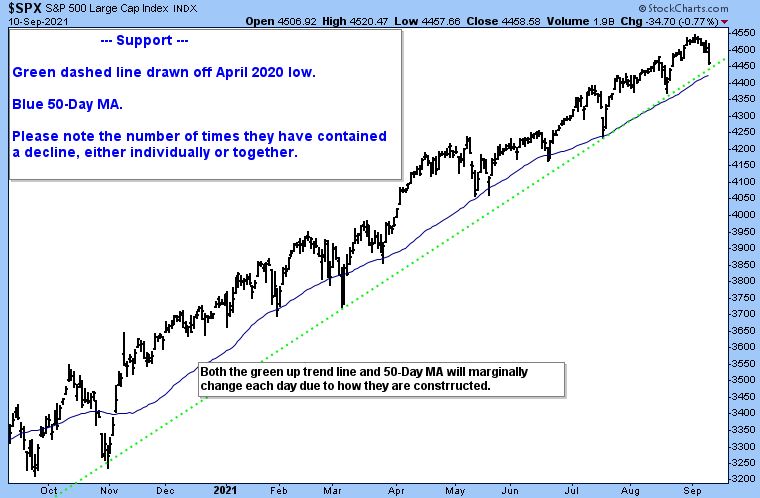
THE GOOD
Figure 3: The S&P 500 (SPX/4458.58) is in close proximity to support, defined by a multi-quarter uptrend line at approximately 4447 (green dashed line) and its rising 50-DMA currently at 4424 (blue line). However, considering how many times each different measuring tool successfully contained a sell-off, if either is violated for any length of time (one week or greater as an estimate), it will represent a “change of character” and increase the odds of further weakness—4382 to 4367 to start.
FINAL THOUGHT (NO CHART)
Small Cap proxy (IWM) remains range bound, as it has been since March. This is another important chart to monitor because:
- Positive changes in Small Cap (and Mid-Cap) stock usually result in positive changes in certain internal measuring tools. This will be important to observe. A breakout higher by IWM through the upper end of the multi-month trading range would signify broader participation and a healthier overall backdrop than what we are currently witnessing.
- A continued short-term recovery in Small Cap and Mid-Cap stocks, on a relative strength basis (versus Large Caps), may help in making progress towards a stronger backdrop—broader participation.
This is the likely path to overcoming the existing negative A/D Line divergences and to a healthier equity market backdrop.
Day Hagan Asset Management appreciates being part of your business, either through our research efforts or investment strategies. Please let us know how we can further support you.
Art Huprich, CMT®
Chief Market Technician
Day Hagan Asset Management
—Written 09.11-12.2021. Chart and table source: Stockcharts.com unless otherwise noted. Seasonality chart source: Equity Clock.com.
UPCOMING EVENTS
- Day Hagan Technical Analysis with Art Huprich, CMT, on September 21, 2021 at 4:15 p.m. ET.
- Day Hagan/Ned Davis Research Smart Sector® with Catastrophic Stop with Art Day, on September 22, 2021 at 1:15 p.m. ET.
- Day Hagan/Ned Davis Research Smart Sector® with Catastrophic Stop with Art Day, on September 22, 2021 at 4:15 p.m. ET.
- Day Hagan Market Update with Don Hagan, CFA, on October 6, 2021 at 4:15 p.m. ET.
Disclosure: The data and analysis contained herein are provided “as is” and without warranty of any kind, either express or implied. Day Hagan Asset Management (DHAM), any of its affiliates or employees, or any third-party data provider, shall not have any liability for any loss sustained by anyone who has relied on the information contained in any Day Hagan Asset Management literature or marketing materials. All opinions expressed herein are subject to change without notice, and you should always obtain current information and perform due diligence before investing. DHAM accounts that DHAM or its affiliated companies manage, or their respective shareholders, directors, officers and/or employees, may have long or short positions in the securities discussed herein and may purchase or sell such securities without notice. The securities mentioned in this document may not be eligible for sale in some states or countries, nor be suitable for all types of investors; their value and income they produce may fluctuate and/or be adversely affected by exchange rates, interest rates or other factors.
Investment advisory services offered through Donald L. Hagan, LLC, a SEC registered investment advisory firm. Accounts held at Raymond James and Associates, Inc. (member NYSE, SIPC) and Charles Schwab & Co., Inc. (member FINRA, SIPC). Day Hagan Asset Management is a dba of Donald L. Hagan, LLC.
