
By Michael Paciotti, CFA
“Inflation is when you pay fifteen dollars for the ten-dollar haircut you used to get for five dollars when you had hair.” – Sam Ewing1
 Every year seems to have a phrase or theme that gets discussed repeatedly and becomes the dominant headline for the year. A few years ago, “social distancing” or “stay at home stocks” were often mentioned, overused phrases. In 2022 that distinction seems to go to inflation. Everywhere you turn, a print journalist, news commentator, or even friends and family can’t help but mention the expensive price of goods and services. While it’s top of mind for most these days, it can be particularly troublesome for those in their retirement years where the issue is plain to see. If income is “fixed” while expenses rise, retiree budgets get squeezed. While this simple view is largely correct, there are deeper implications that become obvious when the problem is stated or structured somewhat differently. In this quarter’s Market Insights, Inflation, Retirement & What You Need to Know, I intend to lay out a framework for examining retirement in its component parts. Specifically, each retiree essentially owns two portfolios, an asset portfolio, along with a liability portfolio. Both are impacted by the macro-economic environment including inflation, one in a temporary way, while the effects of the other are more long-lasting, if not permanent. Through this framework we hope to illustrate a cause-and-effect relationship, along with best practices to solve or at least mitigate inflation’s harmful effects.
The Ins & Outs of Inflation
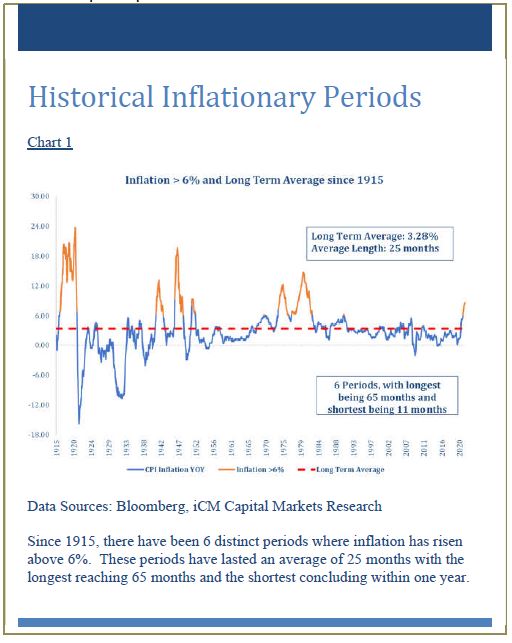
Before we get into our framework, allow me to begin with some background information (Chart 1). Since 1915, inflation has been, for the most part, relatively benign averaging just over 3% per year. However, our recent past has found an even kinder, gentler inflation environment with the 30-year average coming in at less than 2.5% and the 10-year average coming in at 1.75%. Deflation, not inflation had periodically become the dominant theme or catch phrase ever since the Great Financial Crisis in 2008. However, inflation does rear its ugly head from time to time. In fact, since the early 1900’s there have been 6 distinct periods where inflation has risen sharply above 6%, or “spikes” as we’ll refer to them throughout this article. The average duration of these spikes was 25 months with the longest lasting 65 months and the shortest dissipating in just under one year.
There are several contributing factors to inflationary periods, but all are the result of too many dollars chasing too few goods and services. This can occur due to supply shortages like in the 1970’s during the oil embargo or more recently during COVID due to disruptions in the supply chain. Likewise, expansion in the money supply has typically proven to be positively correlated to inflation, especially at extreme levels. If we examine our recent past, we’ve been hit with a tsunami of pro-inflationary forces, including supply chain disruptions, various stimulus packages, along with the enormous wealth effect negative real interest rates had on inflating asset values, such as home values and investment portfolios. Amidst this rush of money chasing fewer goods, labor became scarcer and a valuable commodity. Since labor is the primary input to production for most goods and services, tight labor markets are often linked closely to rising inflation. Couple this with rising oil prices (another key input to shipping costs) and it’s no wonder that inflation has risen to levels not seen since the early 1980’s.
The Asset Liability Framework of Retirement
For folks in retirement, simply stated, navigating retirement comes down to how much you have, how much you earn on that investment, how much you spend (expected and unexpected), and over what amount of time. Not exactly rocket science in terms of parts. When you consider that time is a variable over which none of us have any control, many treat retirement as a perpetuity. That is, how much can I spend without ever running out of money? Likewise, few want to solve problems in retirement by cutting spending during the golden years. Therefore, for the purposes of this exercise, our goal will be to identify how to maximize the lifespan of a portfolio without adjusting spending.
Where does that leave us? Essentially, this leaves us with an asset portfolio on which there is an unknown rate of return and a liability portfolio which also grows by an unknown rate each year. That spending rate is determined by our own habits and inflation.
While most realize they must manage both their pool of available money (their asset portfolio), as well as their expenses to make retirement work, few think of them as competing portfolios affected positively or negatively by external economic variables. For those that have been associated with defined benefit plan (i.e., pension) management, this is a little different than asset/liability matching in actuarial space. In that case, you calculate the present value of a cash flow due sometime in the future. This is then discounted by an appropriate discount rate, which is impacted by current interest rates. In low interest rate environments, a liability becomes amplified because the present value of a distant liability discounted at a low rate is large relative to a higher rate. One might think the same would hold true here. To the contrary, high inflation creates an elevated present liability that is indexed through time to even higher levels, even if the rate of inflation subsides. I mention this for two reasons, clarity in differentiating from the actuarial scenario and to point out the permanently destructive nature of an even one-year spike in inflation. Because a spike sets price levels immediately higher, each subsequent increase is now applied to a higher number, resulting in even more spending (i.e., compounding). A 3% increase on a $100k expense is $3000. A 3% increase after a 10% shock ($110,000) is a $3300 expense in year one plus the $10,000 replayed again and again every year. There is an extra $10,300 just in year 1 after the shock ($113,300 total). Than $116,699 in year 2 and so on and so forth. That higher base due to the one-time shock repeats each year going forward. In fact, by year 30, the difference amounts to $23,565 in that year alone, while the cumulative difference in spending over 30 years is $475,754…all from a one-time shock of 10% and a 3% inflation rate thereafter.
Now the asset side of the portfolio is also not immune to the deleterious effects of higher inflation, specifically inflation spikes. Simply stated, bonds decline so they can be priced at a level that will provide the same return as new bonds, of like maturity and credit quality, coming to market. Afterall, who would want a 4% treasury trading on the secondary market when the identical bond is priced at 5% at auction? The price needs to decline to reset these levels. Specifically, the price of a $1,000 bond would become $922 under this scenario. The appreciation back to par, plus the below market of 4% coupon, will produce the same 5% return over the horizon of the bond as the newly issued 5% bond. This is caused by the discount rate, that we discussed previously, resetting. Higher discount rates lead to lower present values, the opposite of the low-rate high-present value illustration I used when discussing liabilities.
What about stocks? While most academic circles and media outlets would suggest that stocks are the “best hedge” against inflation, this is a bit of a misnomer. Over long periods, stocks are an asset that are high returning enough to outpace inflation. However, they do not respond positively to inflation spikes, in fact quite the contrary. Like bonds, stocks entitle the owner to a stream of cashflows. In the case of equities, it’s a share of earnings that are either passed through as a dividend or retained for future growth. Both accrue value to the shareholder, while the latter contributes to upward moving share prices. Because equities produce long-term future cashflows, their present value is determined by the same mechanism, discounting those future cashflows back to current day and therefore they are correspondingly impacted by the same phenomenon I used in our liability example for bonds. That is, as discount rates increase, the present value declines. In simple terms, this means that stocks typically decline with upward moving discount rates. Now one must be careful as not all rates impact stocks equally. Since stocks are a long-term asset, the appropriate discount rate is a long-term bond rate. Therefore, stocks tend to be more sensitive to shifts in long-term rates than they are to short-term rates. It’s for this very same reason, that stocks don’t like inflation.
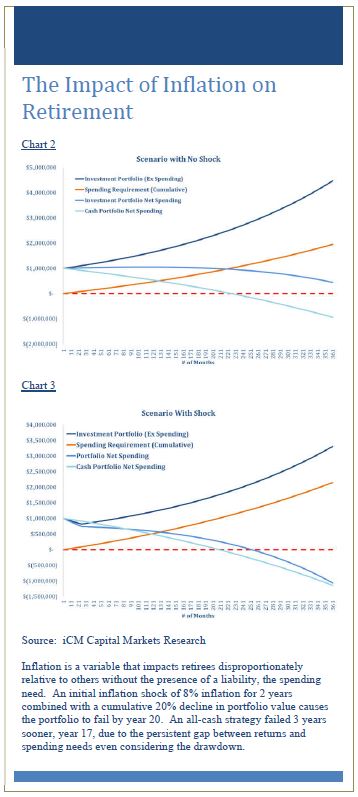 So, where does that leave us? Inflation is a variable that affects a retiree negatively in two ways. First, during inflation shocks, inflation goes immediately higher by a large amount then forms a new base and builds off that new higher level for the duration of the time horizon. Second, inflation, through its impact on interest rates and corresponding discount rates, can cause both stocks and bonds to decline. So quite literally, a retiree gets squeezed from both ends of the equation. Charts 2 and 3 illustrate this. In chart 2 we begin with a $1mm portfolio, with a 4% spending policy. If we assume a 5% annual return and 3% inflation, reasonable assumptions, we can see that after 30 years the portfolio is still intact.
Now in chart 3 we see what happens to the identical portfolio in the presence of an inflation shock of 8% per year for its first 2 years, along with a 20% decline in portfolio value over that same period. After the initial shock, the assumptions are identical as were used in example 1. Additionally, we show a cash portfolio under the same circumstances. For the fully invested portfolio, the initial shock period of 2 years causes the retirement strategy to fail at year 20. Interesting enough, the cash-only strategy fails prior to that, in fact about 3 years prior. If we dig deeper, we learn a few things about each portfolio from this failure. First, since we will assume there is little that can be done about the rate of spending, our focus must be exclusively on the asset side of the portfolio. Admittedly, belt tightening can help, but is not assumed. For the asset portfolio, minimizing losses in the early years is key take away number 1. The more the initial portfolio value is preserved, the better the outcome. Alternatively, increasing the return earned after the shock is also important. We’ll get to the how-to later. Perhaps surprisingly, though, unless the losses in the first two years are disastrously bad, they matter less to the solvency of the portfolio than the “recovery years,” even if earning a relatively modest annual return in recovery. The reason is likely the time involved.
The gains in recovery occur for longer than the shock period. This matters as long as return minus expense is a positive number and is the key reason why the cash strategy fails first. The gap between return and expense is the largest throughout if a retiree elects to abandon strategy and hold nothing but cash. So, let me clearly state our takeaways. 1) Seeking shelter in cash or investing exceptionally conservatively is the least desirable strategy. The result exhausts the portfolio in the shortest amount of time under our assumptions. 2) Retirees should participate in markets in a manner that minimizes losses in the shock period. It is important to not incur such severe losses to permanently impair the portfolio by the spending rate exceeding the sustainable return level during recovery. For example, if you have $1mm and spend 4% while earning 5%, the portfolio is intact after 30 years. If your $1mm portfolio declines in value to $500k and you continue to spend $40,000(4% of the initial value) that’s an 8% spending policy on the lower value in the presence of a 5% return. The portfolio will be bankrupt quickly. 3) One should seek to minimize losses during the shock period, but only to the extent that it doesn’t hamper gains during recovery. Since recovery is the longest, this has the greatest impact on retirement income provided that the rate of return exceeds the spending policy rate.
Summary
Over the course of the preceding pages, we’ve identified that inflation is a beast that we’ve dealt with before, in fact, on 6 separate occasions since 1915. For the last 30 years though, it’s been well contained, likely making our current environment feel even worse. On average, inflationary shocks last for 25 months with the range falling between 11 months and 65 months. Even brief shocks, leave lasting damage, as prices rarely recede, but simply continue to grow off a permanently higher base. As we demonstrated, the effects on a $100,000 annual budget with 3% inflation compared to that same budget and inflation after experiencing an inflation shock of 10% amounted to $475,754 over 30 years. While not discussed, this lasting impact is likely the reason that the Fed is determined to douse inflation even at the expense of recession. Recessions are temporary.
While most think of inflation as a variable that pinches pocketbooks and strains household budgets from a cost perspective, it also delivers a blow to asset values in the form of stocks, bonds, and even real estate. For financial assets like stocks and bonds, where markets discount a stream of future cashflows to arrive at a present value, the connection is through the discount rate. Just as falling interest rates and, correspondingly, discount rates have benefited stocks and bonds over the last decade, rising discount rates are now pressing down on those values. This impacts all investors, but disproportionately retirees, as they find themselves in the crosshairs of declining asset values and unexpected and permanently higher expenses.
So, what is the solution? While there is no perfect answer to solving the inflation problem, there are a few things that investors can do that have led to better outcomes. First, investors should seek to protect principal during this initial shock period, but only to the extent that investors prevent exceptionally bad drawdowns. Otherwise, having a portfolio that rebounds during the recovery period leads to the most optimal lifespan of retirement portfolios. The worst outcome was the cash portfolio, a natural reaction for investors experiencing declines, but a poor choice during inflationary periods, as the gap between return and inflation tends to be the largest over time. The moral seems to be to stay invested at or around your risk tolerance, provided you own a portfolio that is positioned to minimize the pain, while providing that opportunity for recovery.
 But how do you do that? While I may sound like your average barber advocating for yet another haircut, value assets, or those that are cheap compared to their own histories or to other global assets, seem to stand out. The current list of these assets includes US large and small value, international and emerging markets value, and commodities, all of which provide benefits in this current environment. More specifically, owning them in a diversified portfolio aligns with the objectives of avoiding bad drawdowns during the shock period while remaining invested to experience the recovery.
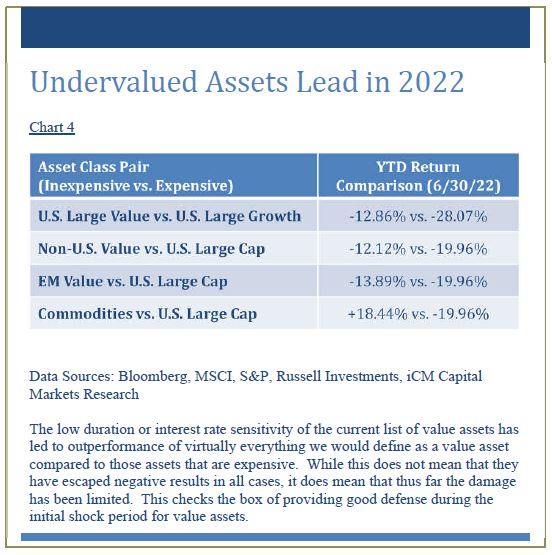
How have value assets helped to achieve these goals thus far (Chart 4)? First, the low duration or interest rate sensitivity of the current list of value assets has led to outperformance of virtually everything we would define as a value asset compared to those assets that are expensive. While this does not mean they have escaped negative results in all cases, it does mean that thus far the damage has been limited. This checks the box of providing good defense during the initial shock period for value assets. Second, and perhaps most importantly, low valuations tend to correlate highly with elevated long-term returns which checks the second box regarding capturing the recovery with a greater potential to outperform your spending rate.
While 2022 has not gotten off to the start any of us had hoped for, our strategies thus far have held serve. Inflation is the variable impacting most investment strategies with ours benefitting from low valuations and corresponding low discount rate sensitivity, as rising inflation and discount rates negatively impact both stock and bond portfolios. We believe, and thus far our experience has shown, that our strategies are up to this challenge. Thank you as always for your continued trust and confidence.
1 Sam Ewing is a former baseball player who played for the Chicago White Sox and the Toronto Blue Jays.
3rd Quarter 2022 Market Insights is intended solely to report on various investment views held by Integrated Capital Management, an institutional research and asset management firm, is distributed for informational and educational purposes only and is not intended to constitute legal, tax, accounting or investment advice. Opinions, estimates, forecasts, and statements of financial market trends that are based on current market conditions constitute our judgment and are subject to change without notice. Integrated Capital Management does not have any obligation to provide revised opinions in the event of changed circumstances. We believe the information provided here is reliable but should not be assumed to be accurate or complete. References to specific securities, asset classes and financial markets are for illustrative purposes only and do not constitute a solicitation, offer or recommendation to purchase or sell a security. Past performance is no guarantee of future results. All investment strategies and investments involve risk of loss and nothing within this report should be construed as a guarantee of any specific outcome or profit. Investors should make their own investment decisions based on their specific investment objectives and financial circumstances and are encouraged to seek professional advice before making any decisions. Index performance does not reflect the deduction of any fees and expenses, and if deducted, performance would be reduced. Indexes are unmanaged and investors are not able to invest directly into any index. The S&P 500 Index is a market index generally considered representative of the stock market as a whole. The index focuses on the large-cap segment of the U.S. equities market.
The TekRidge Center
50 Alberigi Dr. Suite 114 Jessup, PA 18434
Phone: (570)344-0100
Email: [email protected] www.icm-invest.com
