
By Michael Paciotti, CFA
“Most traders are picking pennies in front of a steamroller, exposing themselves to the high-impact rare event yet sleeping like babies, unaware of it.” – N.N. Taleb [1]
There is a meme circulating social media from the movie Back to the Future where Doc, exiting the DeLorean proclaims, “Marty, whatever you do, don’t go to 2020!” I think that accurately sums it up. 2020 has ranged from sad, to terrifying, to outright bizarre, in both real life and from a data practitioner’s perspective. At this point last year, who would have thought that we would experience a global pandemic that would result in 85mm confirmed cases of COVID-19, with as many as an additional 340mm unconfirmed cases, and 1.9mm deaths occurring because of the virus. In the U.S. alone, we’ve had ¼ of those cases, roughly 21mm reported along with roughly 352k deaths.
Who would have thought that global GDP would decline by 10% during the 2q, with U.S. GDP declining by 30%, a fall in economic output that is rivaled only by the great depression? Who would have thought that amidst 20mm people losing their jobs, the US economy would recover 2/3 of that lost economic growth by the 3rd quarter and do so with 10mm people still unemployed? And who would have thought amidst all of this, less a one-month white knuckle moment, that financial markets would be trading at or near record high prices? Yet, as fall fades to winter, we have done all of that folks…in 2020.
2020 was a strange year of black swan events, ranging from unprecedented shocks to our economy to a massive fiscal response in the form of the $2T CARES act. While fiscal policy measures have been a friend to Main Street, liquidity measures have been a friend to Wall Street. This has impacted U.S. stock and bond prices, as well as housing prices and credit markets, pressing them to the point where we would start to refer to both housing and stocks as dual bubbles, leaving the Fed in the unenviable position of having to deal with both simultaneously. The focus of this quarter’s Market Insights, ‘2020, Black Swans Everywhere!’ will be to discuss several of these black swan events and the corresponding risks that go along with them.
Reports of My Death have Been Greatly Exaggerated – 60/40
Last year at this time I, like many others, wrote about the future of the conventional 60% stock 40% bond portfolio in our 1q 2020 Market Insights, The Future of 60/40. In it, I concluded that the long-term future of 60/40, the next decade, looked rather bleak. My analysis revealed different problems than most others, and as a result different solutions, but the assessment was the same. 60/40 was likely to struggle, producing returns of about 3% per year on average, gross of management fees and expenses. While one year hardly represents the entirety of the decade that my peers and I spoke of, none of us are off to a very auspicious beginning to our forecast, as the generically diversified 60/40 portfolio I used in my prior letter gained 13.8% in 2020. I reference this both as a mea culpa for myself and the remainder of the industry, as well as a starting point to our discussion on black swans.
The definition of a black swan event can be paraphrased as an event with an exceptionally remote probability, but one that comes with severe consequences. In that regard, I am taking some creative liberty with the definition because many of the outcomes that I speak of are very rare, with extreme consequences, but positive. That is, they created gains for investors. These rare events that were the result of something bad and remote, resulted in something equally remote, but positive in several cases. Take for example a basic 60/40 portfolio of U.S. stocks and treasuries. The average annual return of this simple strategy over nearly 100 years has been 8.68% per year. While I would hardly describe it as a black swan, achieving a return of 13.8% or greater on a 60/40 strategy is certainly above average but well within statistical norms. Said differently, 60/40 had a solid, but unspectacular year in 2020. This is not among the black swans that we speak of. However, what was required to create this average year can be described as black swan.
To start our list of black swan events, let’s start with U.S. bonds. In 2020 U.S. treasury bonds turned in a very strong 8% gain for the year. The probability of this occurring is remote at about 25%, but hardly a black swan. Creating this gain from a beginning yield of 1.91% on the 10-year treasury, however, starts our journey into black swan. During the first few months of the year, treasury yields declined to a low of just 0.31%. This decline represents a 2 standard deviation event or about a 2% probability. Going a step further, if we look at the one-year decline in yield from 2.53% to 0.31%, this is a 3 standard deviation event or 0.13% probability. Now, if we consider that it’s a heck of a lot easier to shed 2.22% beginning from a 10% yield than it is from a 2.5% yield, the 88% decline in rates, and corresponding gain in bonds, was a true black swan moment, a 5 standard deviation event (1 in 3.5mm occurrence or a 0.00003% probability). This black swan directly impacted the 40% of 60/40 and indirectly impacted the other 60%. More on this shortly.
U.S. stocks by contrast entered 2020 with valuations in the top 4% observed over the last 140 years. From this level or higher, the average return over the next 10 years is 1.38% per year +/- 3.08%. For the S&P 500 to continue to produce gains of 18% for the balance of the decade would require a 5 standard deviation event or a .00003% probability, with the maximum return ever recorded from a decade beginning at this valuation level being 7.69%. How about 1-year results? The average 1-year return from this valuation level is 3.6% with a very wide range of possibilities at +/-16.69%. Considering this, the likelihood of even a 1-year gain of 18% from this level of valuation is projected to be just 19%. In the real world it occurred just a tick more than projected, in 16 of 66 observations or 24% of the time, hardly a black swan, but once again unlikely.
To compound this even further, the decline in rates that we identified as a real black swan is largely responsible for the short-term gains in equities via the positive impact that declining rates and the flattening yield curve both have on short-term equity valuation changes. Driving down rates and flattening the yield curve empirically justifies a higher PE multiple in the short-term. When you combine this with the $2T CARES act and its corresponding support for consumer spending, it becomes apparent that equities, fixed income and, as a byproduct, the 60/40 portfolio truly pulled a rabbit out of the hat in 2020.
Nobel Wants its Prize Back
Hello Dr. Fama, this is Mr. Nobel calling, can I have my prize back? All kidding aside, it has been a tough go for value stocks. And, while no one will be calling Drs. Fama or French for their Nobel Prize, the formation of a growth bubble should not diminish the iconic nature of their work or the conclusions drawn from it. The market is usually so enamored with growth stocks that investors pay too high a price for the glamour of those names and stories, creating all the makings for a speculative bubble, which can have disastrous consequences for investors down the road. Take Tesla, for example, which appreciated 743% in 2020 and by nearly 877% from its March low. As a result, Tesla’s market cap is now greater than the top nine global auto manufacturers combined, despite selling about 425,000 cars in 2020 vs. about 51mm cars sold by the top nine[2]. Tesla is a great story, but is the story worth enough to exceed the combined value of Toyota, Honda, Volkswagen, Renault- Nissan, Hyundai-Kia, SAIC Motor, Fiat Chrysler, Ford, and GM… who collectively sell 100x the number of vehicles as Tesla? Probably not. But who would ever buy Tesla under these conditions? If you own an S&P 500 index fund, you are about to. Tesla was added to the S&P 500 in mid-December.
This systemic and predictable overpricing of growth names in most non-euphoric environments has historically allowed boring old value stocks to outperform. The key to that last sentence is in “most non-euphoric environments”. 2020 has been a perfect storm in favor of growth names, many of them high tech and clearly benefit from people staying at home. While value has stormed back throughout much of 4q, through October value trailed growth by -31% over the prior one year. Getting back to our swans, this one-year result was a 2.6 sigma event or probability of about 0.46%. In the real world, it’s not even that likely. It has never happened before this. The closest was -29% from July of 1999 to June of 2000. You may recognize this time frame as the peak of the internet and growth bubble.
Longer-term, value has also struggled, trailing growth by 7% annualized over the last decade, itself a 2.76 standard deviation event (0.28% probability). This in turn has led to some extreme valuation discrepancies between value and growth. On every metric, value is at least 2 standard deviations undervalued, and as much as 4 standard deviations undervalued relative to growth, remote to black “swan-ish” for sure. While value normally trades at a discount to growth, some of these metrics are reaching extreme discounts of 70-80%. As Fama and French so appropriately pointed out, the value factor is a risk premium. From fair value, value wins most of the time and by a fairly substantial margin. Check back in a few years, but I would bet that those who eschewed growth in favor of value might be happy by then. We’ll call this The Return of Fama and French.
Seeing the Forest for the Trees
At times, visualizing the enormity of an event takes stepping back from it and seeing the big picture. For many years now we’ve discussed the overvalued nature of U.S. stocks. We’ve quoted historical price-to-earnings ratios, cyclically adjusted price-to-earnings ratios, referenced what quartile, decile or percentile current valuations lie in, and even demonstrated the accuracy of our equity valuation model in predicting long-term returns via the overlapping nature of predicted vs. actual returns over time. I’ve long wondered if all of that was a bit esoteric and almost surreal to many. While the science and data supported it, it was and is difficult to not believe what our eyes were seeing…that U.S. stocks are doing quite well and are ultimately very healthy. As a research and data driven firm, we analyze and evaluate hundreds, if not thousands of theories and data series. By sourcing new ideas, different ways of looking at old problems, that’s how you continue to improve. The series of charts on the following page jumped out at me, not only because of the story it told, but for its simplicity. Panel 1 shows the price gains of the S&P 500 on one line and its earnings growth on the other. Both lines have been scaled to 100, so we can see which is growing faster. The first message is that from 1871 until 1988, cumulative price gains matched cumulative earnings gains. Over 117 years, prices advanced and so did earnings, without one ever running away from the other. In panels 2 & 3, we show these series individually plotted against their own trendline. In both cases, prices and earnings are ahead of the pace that their trendline would put them on and that each series has historically and very reliably reverted to over time.
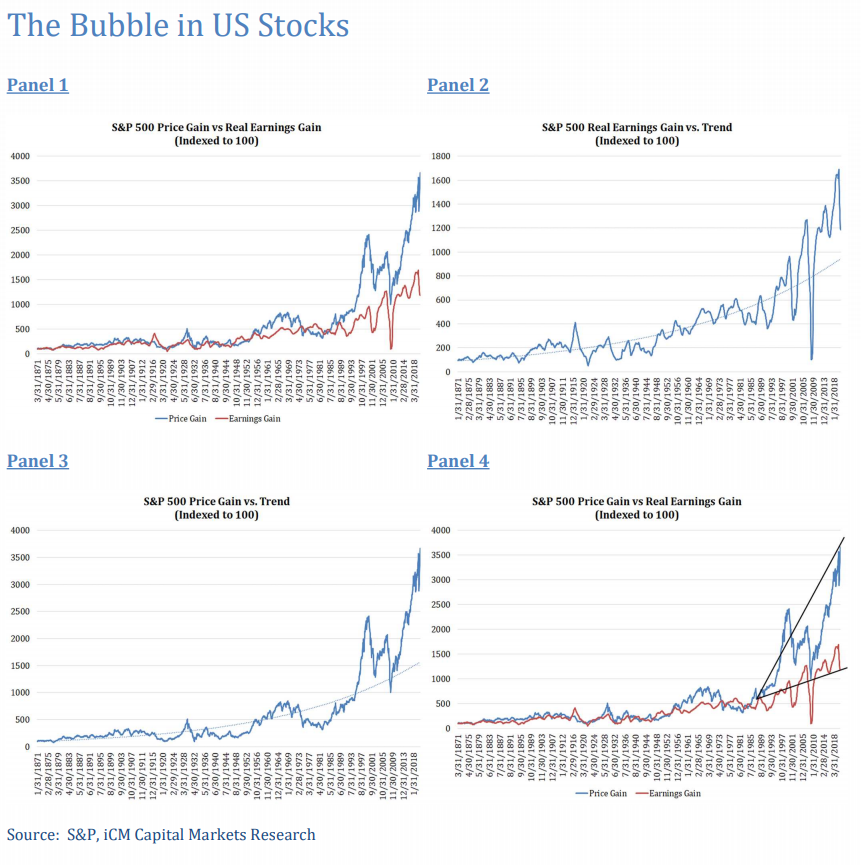
The punch line is illustrated in panel 4, which is just a repeat of panel 1 with some annotations. Price gains cannot outpace earnings gains or the market becomes expensive. Prices and earnings have reliably converged on each other for well over 100 years. However, beginning in the late 80’s, price gains have outpaced earnings gains by a near 3-to-1 margin. The diverging arrows show the formation of a real predicament, the bubble that has formed in U.S. stocks. While the gap between price gains and earnings gains is clear, what’s ultimately worse is that earnings themselves are above trend. Theoretically, prices should meet earnings at the earnings trend line, to be considered fairly valued. With earnings above trend, this should also dispel the notion that perhaps we can solve this problem by growing our way out of this (i.e., the bottom-up solution). While the concept of earnings growing faster would be ideal, it is not realistic assuming that the growth rate of earnings over nearly 150 years of data was accurate of course. The takeaway should be that there is significant risk in today’s market valuation, and that further gains are likely to be greatly diminished as we amortize these excesses away over time. Now all this being said, what we are currently witnessing does not predict an imminent crash, however, one is certainly possible. And…speaking of swans, price-to-trendline earnings as shown previously, is itself a 3.7 standard deviation event. To quantify this in simple terms, at best, stocks can provide a growth rate equal to the pace of real earnings growth plus dividend and inflation without further exacerbating the problem. This would equate to about 5.4% annually and, unfortunately, is the maximum return that U.S. stocks can provide without further inflating or, for that matter, deflating the bubble. Conditions would begin and end as they are now. The likely return, as we have stated many times previously, is unfortunately lower.
Conclusion
2020 is certainly a year that none of us would have imagined. While a global pandemic and widespread unemployment are among the black swans impacting Main Street, these real-world events have had a cascading effect into the world of finance, contributing to, if not causing, a multitude of black swans that have had an impact on Wall Street. We’ve talked about solutions quite a bit in past Market Insights. In essence, they can be summarized as finding returns outside of the U.S. or in unconventional formats. Without going into detail, undervalued nondollar denominated assets, especially on the value side of the market, remain especially undervalued even after their rebound from 2020 lows. Additionally, real assets provide both a hedge against higher future inflation and they themselves are a cheap asset. We can also look to certain product structures, like closed end funds, which at times can provide attractive characteristics of higher yields and discount prices that when combined can also add to return. I continue to believe that while limited, there are enough fair-to-undervalued assets to get to a reasonable return with a reasonable level of risk. The key will be structure. Investors can no longer allow U.S. stocks with their poor prospects, and U.S. bonds with yields below 1%, to command 80% of a portfolio allocation. The math simply doesn’t work. Now is the time to be fearful of the same old, same old and not the time to fear being different. On behalf of all of us at iCM, I wish each of you a healthy, happy, and prosperous new year. Thank you as always for your trust and confidence.
Originally published by Integrated Capital Management
[1] Nassim Nicholas Taleb[a](/ˈtɑːlԥb/; alternatively Nessim or Nissim; born 1960) is a Lebanese-American (of
Antiochian Greek descent) essayist, scholar, mathematical statistician, and former option trader and risk analyst, whose work concerns problems of randomness, probability, and uncertainty. His 2007 book The Black Swan hasbeen described by The Sunday Times as one of the twelve most influential books since World War II.
[2] Source: Research Affiliates: Tesla, the Largest-Cap Stock Ever to Enter S&P 500: A Buy Signal or a Bubble?
Rob Arnott, Vitali Kalesnik, Lillian Wu December 2020
1st Quarter 2021 Market Insights is intended solely to report on various investment views held by Integrated Capital Management, an institutional research and asset management firm, is distributed for informational and educational purposes only and is not intended to constitute legal, tax, accounting or investment advice. Opinions, estimates, forecasts, and statements of financial market trends that are based on current market conditions constitute our judgment and are subject to change without notice. Integrated Capital Management does not have any obligation to provide revised opinions in the event of changed circumstances. We believe the information provided here is reliable but should not be assumed to be accurate or complete. References to specific securities, asset classes and financial markets are for illustrative purposes only and do not constitute a solicitation, offer or recommendation to purchase or sell a security. Past performance is no guarantee of future results. All investment strategies and investments involve risk of loss and nothing within this report should be construed as a guarantee of any specific outcome or profit. Investors should make their own investment decisions based on their specific investment objectives and financial circumstances and are encouraged to seek professional advice before making any decisions. Index performance does not reflect the deduction of any fees and expenses, and if deducted, performance would be reduced. Indexes are unmanaged and investors are not able to invest directly into any index. The S&P 500 Index is a market index generally considered representative of the stock market as a whole. The index focuses on the large-cap segment of the U.S. equities market
www.icm-invest.com
