
By Michael Paciotti, CFA, Integrated Capital Management
“Speculative bubbles do not end like a short story, novel, or play. There is no final denouement that brings all the strands of a narrative into an impressive final conclusion. In the real world, we never know when the story is over.” – Robert Shiller
How do bubbles form? It’s a fair question and, honestly, it’s a difficult one to answer because we first need to agree on what even constitutes an asset price bubble. As quantitative researchers, we would argue that any price level that has deviated above its norm qualifies as a bubble. In fact, for us, that’s where the definition starts and ends. There is a normal range. If an asset trades above that normal range (outside of 1 standard deviation) we would call it a bubble. Others may take exception to the level at which we assign the word “bubble.” In our definition, an asset would need to trade at a valuation greater than 83% of all other outcomes. This is certainly expensive, but leaves a good deal of room, to become even more expensive, which in a statistical world happens in about 1/6 outcomes. If we assign the term to 2 standard deviations or greater, the valuation level is then in roughly the top 2% of all observed or a 1/44 outcome. Po-tae-to, po-tah-toe…. we don’t take great exception to either level being used. It’s just the frequency, or lack thereof, that you expect them to occur that will drive you to one definition or another.
For some, to be a bubble, a simple elevated price level isn’t enough. Asset prices need something more, usually speculative investor behavior in addition to elevated prices. To us, when it really comes down to it, all great bubbles share one thing in common. They form one seemingly logical step at a time until the investor arrives at an unreasonable destination, looks around, and realizes the absurdity. Without the first part, the seemingly logical sequential progression, I doubt we would ever experience a bubble, as they would be too easy to spot. That is, without the sensational narrative that rationalizes away steps upward in valuation, I doubt they would occur. How does this relate to today? I’m going to argue that today US stocks exhibit all of those elements, and that we’ve been slow played, one seemingly logical step after another, beginning with the Great Financial Crisis, to an unreasonable destination. That destination being a level of overvaluation, unsupported by fundamentals, that sits right underneath our noses and will likely be responsible for US stock returns that are 1/3 or less of their historical averages for the next decade.
Building Blocks of Return
To understand how we arrived at our current destination, reasonable or not, we must first understand what causes returns in equity prices. Attributing equity performance can be like slicing an onion where each cut gives you a different look, all are simply different slices of that same onion. We prefer to slice the onion into four components or building blocks — inflation, growth of real earnings, dividend yield, and P/E multiple expansion. This last piece is of particular interest because multiple expansion (or contraction) is nothing more than a fancy way of saying the change in valuation, or how much the bubble has inflated.
Over any period, we can break equity market returns into these four components. For example, the average price of the S&P in the month ended September was 4493. If we look back 100 years prior that same value was 7.06. This is consistent with an annualized price gain of 6.68%
per year for that 100-year period, while the dividend also contributed 3.87% per year. Therefore, the total return for the S&P 500 for the last 100 years was 10.82%. If we do the same exercise derived from the aforementioned building blocks, we get 2.8% for inflation, 1.85% for growth of real earnings, 1.89% for an increase in valuations (multiple expansion), and, as previously stated, 3.87% for the dividend. If we combine those numbers, we arrive at 10.826% for the 100-year period, serving as a proof that the four building blocks are the source of return in equity portfolios.
Building a Bubble
Chart 1
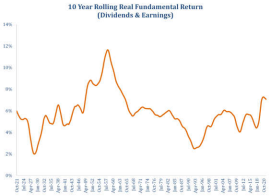
The last decade has produced an average annualized return on the S&P 500 of 16.52% per year compared to 10.82% per year historically, well above average. However, the real “fundamental return,” the return generate by earnings and dividends, was just above 7% for the last decade compared to an historical average of 5.79%.
Building this Bubble, Block by Block
Let’s look at the last decade. For the ten years ended September 30th, the total return for the S&P 500 was, a well above average, 16.52% per year, using monthly data supplied by Morningstar. This ten-year period was itself a 1.5 sigma event, a 6% probability, or simply put, about a 1 in 15 outcome, meaning for every 15 decades we experience it would be normal to see this happen once. If we break down this extraordinary period, we get 1.9% from inflation, 5% from growth of real earnings, 6.86% from multiple expansion, and 1.96% from the dividend. This computes to a total return calculated from the building blocks of 16.51% annually, which ties to the reported return within a very narrow margin of error.
Now, if we remove inflation and multiple expansion (the greater fool), the last decade, on purely fundamental merits, produced a 7.06% gain (Chart 1). When we consider the long-term average real fundamental return (dividends and earnings) on stocks has been 5.79% over the last 100 years, our spectacular decade looks nothing more than slightly above average. Fundamentals generated an extra 1.27% per year, while investors lining up to pay more accounted for the rest. Specifically, inflating valuations accounted for a cumulative 94% gain, more than half of the last decade’s total return (Chart 2).
Chart 2
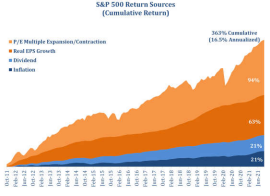
As illustrated in the chart above, more than half of the real return was caused by US stocks becoming more expensive, 94% to be exact. Earnings and dividends provided 63% and 21% respectively begging the question of, s this sustainable? Data source: S&P, iCM Capital Markets Research
Similarly, much has been made about the dichotomy between growth and value styles, driven by the 19% gain for growth stocks compared to the 12% gain for value over the last decade. With seismic shifts in consumer preferences, in terms of how they spend and consume, to massive innovation by firms like Tesla, surely this disparity can be explained by fundamentals. However, this is not so. Over this period, value stocks generated a fundamental return of 6.04%. Growth stocks by comparison….6.95%. This would imply that only 0.91% of the annual 7% performance gap (96% compounded over 10 years) between growth and value is explained by fundamentals. Growth stocks just got more expensive relative to value.
Let me spend a few moments on two blocks in this equation that should be of particular interest, because I would argue they are unsustainable even at current levels. First, allow me to put valuation multiples in context by stating them a little differently. When you buy a stock, you are buying a business. The valuation multiple represents how many years it will take to recover your initial investment through the earnings the business produces. Historically, the market has traded at an average of about 17x earnings or in 17 years you will recover your initial investment from the current earnings of the business (sounds like a long time when you put it that way, doesn’t it?). Today the US market trades at a valuation of 40x the average of the last 10 years earnings. Stated differently that’s 40 years to recover your investment from current earnings, or more than twice as long as normal, because you are paying nearly twice as much. Now, to replicate the same 16.5% return from the prior decade over the next decade, the return from valuations increasing needs to be 6.86% per year as we identified earlier (the non-fundamental return). That would increase the valuation multiple from 40x today to 77x at the end of the decade. It would then take an investor 77 years to recover their initial investment from current earnings. Reasonable? Certainly not. But that’s what would be required to get that same contribution of 6.86% from valuations increasing.
Earnings to the Rescue?
Chart 3
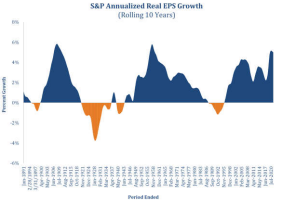
Annualized 10-year real earnings growth of 5% or greater is fairly rare, happening only 3 times in the last 100 years. Data source: S&P, iCM Capital Markets Research
The second block that should pique our interest is earnings growth. A common argument that attempts to rationalize current high valuations is that earnings have been, and will continue to be, well above average. Earnings grew at a remarkable 5% per year for the last decade after accounting for inflation, compared to the 100-year average of 1.85% (Chart 3). This represents a 1.95 sigma event, or a probability of about 2.5%. In the real world, as we can see in Chart 3, this has happened just three times in the last century, including this most recent decade. How likely is this to repeat? To answer that, let’s look at this from an economic perspective.
For earnings growth to be high over a sustained period, it needs to be supported by strong economic growth. The US has not attained real economic growth of 5% or greater for a 10-year period since 1950, and for good reason. Real GDP growth can be largely explained by growth of the labor force and productivity growth. Unless there are massive hidden pockets of workers waiting to jump into the pool, comparable to the shift that occurred when America moved from the one-worker to two-worker households, people will need to start having more babies for this to help… alleviating the problem in approximately 18 years. To put this in perspective, for growth of the labor force to account for even half of the 5%, the total labor force would need to become 28% larger 10 years from now, a very tall order if not an impossibility. That leaves productivity growth. Aah…we will be massively more productive due to shape-shifting technology like artificial intelligence, automation, and blockchain. Going back to 1948, the US produced $21 of real GDP per hour worked. This compares to $75 per hour worked at year end 2020, impressive gains. However, when we look at the annual growth rate, we see that the maximum one-year gain in productivity was 3.87%, while the average over the past 70 years was only 1.77% per year. While some would argue that the point of automation and AI is to make us massively more productive, in essence replacing human labor, remember, the expansion of the labor force is as much about those new entrants earning and having money to spend, as it is about producing a good to be sold and improving profitability. Automation does not solve this because there is no wage being paid and subsequently re-spent in the economy.
So where does that leave us? Given that multiples are unlikely to expand at the same rate as they have in the past (if at all) and earnings are unlikely to repeat the results of the last decade, it becomes apparent that returns will likely be reduced without those contributions. The question is by how much. The dividend yield is currently 1.3%. If we get 2% inflation and historical average earnings growth of 1.85%, this would produce a 5.23% annual return for the decade. That, however, leaves you at the same valuation as today 10 years from now, 40x earnings. If that high valuation corrects, this will further reduce returns, as valuations recede in the mirror image of how they increased returns over the last decade. At 40x earnings, the multiple needs to fall by 50% to approach the historical average. If this reverts only partially, to 30x, the 10-year return would be 2.86% per year. However, if multiples end the decade at 20x earnings, the return for the next decade would be just 0.88% per year, leaving us with a reasonable expected return range of flat to low single digit returns on US stocks.
Summary
The past 10 years have been an extraordinary period for US stocks with the S&P 500 gaining an annualized 16.52% per year and large growth stocks gaining more than 19% per year. Many want to point to exceptional fundamentals, strong earnings growth, and dividends, the results of a strong economy, as the drivers behind one of the best periods for stocks in US history. While the fundamentals have been good, I think that we have shown that this period of exceptionalism is better described as a period that is only slightly above average. The gap taking you from average to exceptional was filled by valuations increasing, as investors gobbled up stocks, each paying more than the person before them. The narrative that supports this is compelling on the surface; quantitative easing & low rates post-Financial Crisis, corporate tax cuts, more quantitative easing and even lower rates, plus trillions in stimulus, providing the ammunition for seemingly large economic gains, but gains fed by government borrowing not organic growth. Individually these are all highly supportive of stocks. But, how are bubbles formed folks? One seemingly logical step at a time until you reach an unreasonable destination. The stacking effect of this narrative has left us at that destination. That destination being the prospect of another lost decade for US stocks, the 2nd in the last three. The pertinent question now is not how the party can continue, because all good things must eventually end. Rather, the question more appropriately stated is, where’s the next party? This is a topic of many past and, I expect, future Market Insights. Thank you as always for your continued trust and confidence. I wish you all a happy holiday season and happy new year!
For more news, information, and strategy, visit the ETF Strategist Channel.
1st Quarter 2022 Market Insights is intended solely to report on various investment views held by Integrated Capital Management, an institutional research and asset management firm, is distributed for informational and educational purposes only and is not intended to constitute legal, tax, accounting or investment advice. Opinions, estimates, forecasts, and statements of financial market trends that are based on current market conditions constitute our judgment and are subject to change without notice. Integrated Capital Management does not have any obligation to provide revised opinions in the event of changed circumstances. We believe the information provided here is reliable but should not be assumed to be accurate or complete. References to specific securities, asset classes and financial markets are for illustrative purposes only and do not constitute a solicitation, offer or recommendation to purchase or sell a security. Past performance is no guarantee of future results. All investment strategies and investments involve risk of loss and nothing within this report should be construed as a guarantee of any specific outcome or profit. Investors should make their own investment decisions based on their specific investment objectives and financial circumstances and are encouraged to seek professional advice before making any decisions. Index performance does not reflect the deduction of any fees and expenses, and if deducted, performance would be reduced. Indexes are unmanaged and investors are not able to invest directly into any index. The S&P 500 Index is a market index generally considered representative of the stock market as a whole. The index focuses on the large-cap segment of the U.S. equities market.
The TekRidge Center
50 Alberigi Dr. Suite 114
Jessup, PA 18434
Phone: (570)344-0100
Email: [email protected]
www.icm-invest.com
