
As mentioned, it will be interesting as more live data is compiled on the effects of performance chasing in factor ETFs. Depending on the strategy, we’ve seen several back tests underperform once live. One can suspect that investors will bail on that underperformance at the wrong times, as usual.
Forget About Correlations
The simple, equal-weighted, strategic-factor buyer has a lot going for him or her. The excess performance of each of the aforementioned five factors tends to be loosely correlated, with size and value having the strongest correlation. No wonder so many multi-factor products are hitting the marketplace, as it makes a ton of sense to mix and match low-correlated factors together to smooth out the overall ride.
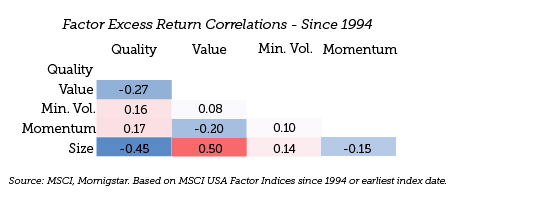
Now the tactical-factor buyer may be tempted to go all-in on a specific factor that is, perhaps, exhibiting attractive valuations and strong momentum. He or she would be wise to, at a minimum, pair that exposure with an uncorrelated factor. Take the recent run in value as an example. Value came alive in 2016 and has since faded somewhat this year (at least domestically). Two of the best performing factors this year, quality and momentum, pair nicely with value due to negative correlations.
Factor investing will continue to evolve with the smart beta ETF landscape. Arming investors with these tools will likely lead to more incidents of investors shooting themselves in the foot. But, effectively managing factor allocations and exposures has a strong place in investment management, and the ETF strategist world is well-equipped to regain some lost ground in recent years.
Grant Engelbart is a Portfolio Manager at CLS Investments, a participant in the ETF Strategist Channel.
Disclosure Information
Investing involves risk. There is no guarantee that investment in any program or strategy discussed herein will be profitable or will not incur loss. Past performance is not a guide to future performance. This information is prepared for general information only. Information contained herein is derived from sources we believe to be reliable, however, we do not represent that this information is complete or accurate and it should not be relied upon as such. All opinions expressed herein are subject to change without notice. The graphs and charts contained in this work are for informational purposes only. No graph or chart should be regarded as a guide to investing. 2620-CLS-6/2/2017
