
In response to the COVID-19 pandemic lockdowns and financial market turmoil, the U.S. Federal Reserve (Fed) initiated multiple forms of support for the financial system including quickly injecting record amounts of money. At the same time, the federal government began multiple forms of fiscal stimulus, such as sending checks directly to individuals and families. In the following graph, we show the amount of money in the economy as measured by M2, personal income, gross domestic product (GDP), and the Consumer Price Index (CPI), each indexed at 100 as of July 2019 before the interventions began.

As you can see, the combined effects of both monetary and fiscal stimulus led to increased money growth and jumps in personal income. All this new money in the hands of the private sector increased demand and pushed the pace of economic growth higher while inflationary pressures gained steam about a year later. Again, the rise in personal income, economic growth, and inflation can all be tied to the massive government interventions in the economy.
Two years on, we are still feeling the effects of these unprecedented government interventions. The labor market is only now getting back to normal rates of monthly jobs creation while the Consumer Price Index (CPI), though still above the Fed’s target, is running only a third of the annualized rate of a year ago. Meanwhile, interest rates continue to be highly volatile, and the stock market has been booming. More accurately, a small subset of the stock market has been booming.
Note that the full impact of the Fed’s more recent policy tightening has likely not yet been entirely realized in the economic data due to the typical lag associated with shifts in monetary policy as well as the massive boost in household and business net worth resulting from the government’s previous stimulus. After raising interest rates persistently as economic growth slowed, the Fed’s Effective Fed Funds Rate is now above the latest annualized growth rate for Nominal GDP as well as the rate of inflation and long-term interest rates. Historically, tight monetary policy such as this has served to further slow economic growth and ease inflationary pressure over time.
INVESTMENT IMPLICATIONS
Long-term interest rates are heavily influenced by expectations for economic growth and inflation. We think that slowing economic growth and falling inflationary pressure will lead to lower long-term interest rates. This should be a positive development for bond holders as bond prices should rise. Falling long-term interest rates would also be beneficial for home buyers as mortgage rates should decline.
Turning to the stock market, this year’s gains have been led by a very few primarily large cap growth stocks whose stock prices have become very expensive relative to sales and earnings. History shows that narrow market leadership and especially stretched valuations will not hold. Those who expect this narrow market leadership to continue are betting against history.
These recent market distortions are reflected in several stock market measures. For example, as seen in the weight of the top ten stocks in the S&P 500 Index as a percentage of total market capitalization (exhibit 2), the Index’s performance has recently been dominated by only a few companies. In fact, the percentage of companies outperforming the S&P 500 Index this year has fallen to a historically low level.
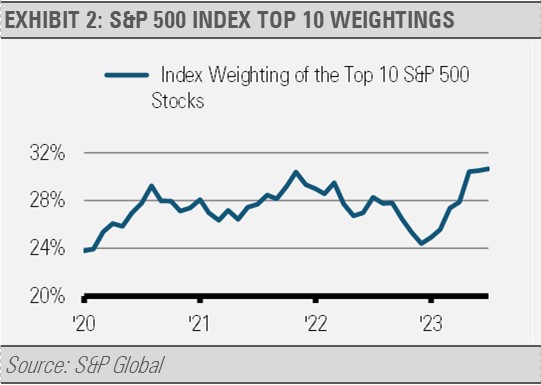
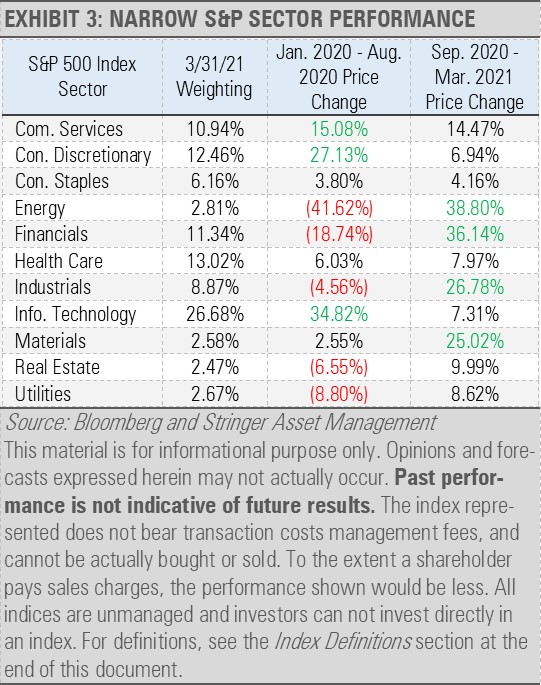
In the past, such narrow market leadership has not persisted. We saw this phenomenon as recently as the post pandemic market recovery of 2020-2021. Then, as is the case currently, market leadership was dominated by companies in just a few sectors. After an initial run, the companies that led went on to lag the other areas of the market over the coming months. We expect that the equity market will show a similar trend in the months ahead.
Meanwhile, these market distortions have created a bounty of investment opportunities. While valuations have become stretched in the large cap growth space, valuations in areas that the market has largely ignored this year look far more attractive. Exhibit 4 illustrates the valuation differences we are seeing across different areas of the U.S. equity market.
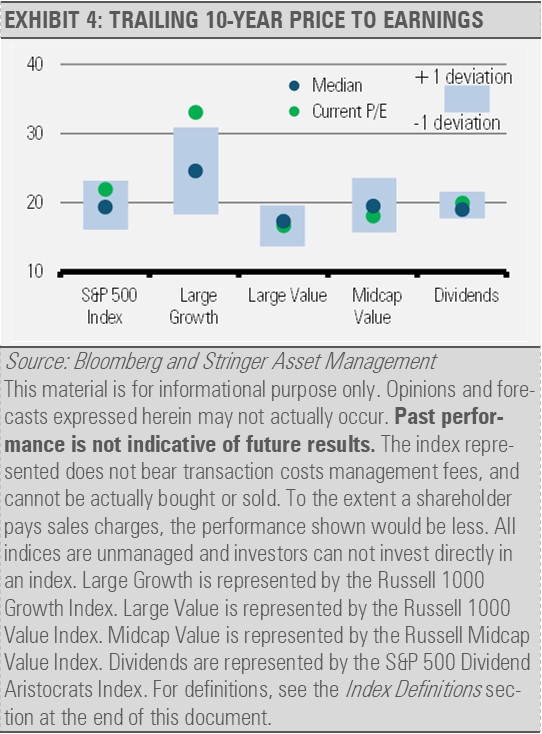
We think this narrow market rally has left plenty of room for other areas beyond U.S. large cap growth equities to perform well, especially in midcap value as well as equity income holdings that generate attractive current yields and should benefit if we see more market volatility ahead.
Following a strategy that puts risk first to find attractive investment opportunities can help ease investors’ nerves, especially when headlines look bleak and market volatility increases. In these challenging environments, we think that investors should stick to their well thought out financial plan and utilize diversified strategies to help mitigate market risks.
Remember that chasing investments that have already run-up and become expensive has historically not worked well. Rather, over time markets favor investments in areas that have attractive relative value. Given our cautious outlook, we have found plenty of areas that represent attractive relative value in high quality bonds as well as value and equity income.
CASH INDICATOR
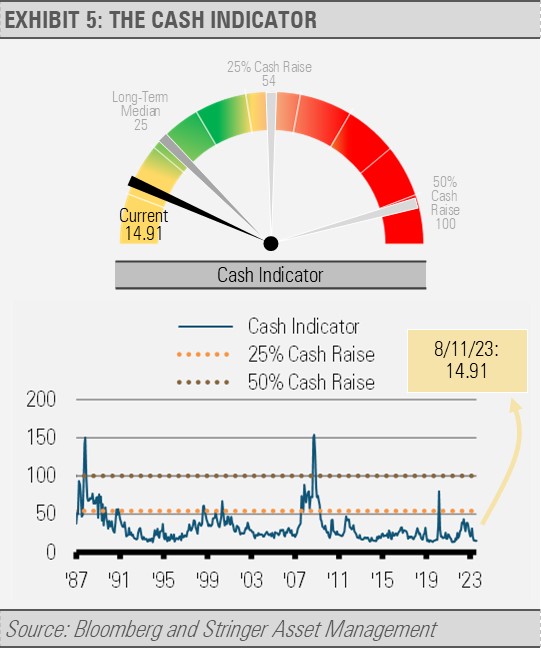
The Cash Indicator (CI) remains below its long-term median level (exhibit 5). At this level, the CI suggests that the markets may be overly complacent. While we are very optimistic about the U.S. economy and equity markets over the longer term, the combination of stretched valuations in certain areas of the equity market combined with the financial markets’ complacency has us taking a more cautious stance than usual.
DISCLOSURES
Any forecasts, figures, opinions or investment techniques and strategies explained are Stringer Asset Management, LLC’s as of the date of publication. They are considered to be accurate at the time of writing, but no warranty of accuracy is given and no liability in respect to error or omission is accepted. They are subject to change without reference or notification. The views contained herein are not to be taken as advice or a recommendation to buy or sell any investment and the material should not be relied upon as containing sufficient information to support an investment decision. It should be noted that the value of investments and the income from them may fluctuate in accordance with market conditions and taxation agreements and investors may not get back the full amount invested.
Past performance and yield may not be a reliable guide to future performance. Current performance may be higher or lower than the performance quoted.
The securities identified and described may not represent all of the securities purchased, sold or recommended for client accounts. The reader should not assume that an investment in the securities identified was or will be profitable.
Data is provided by various sources and prepared by Stringer Asset Management, LLC and has not been verified or audited by an independent accountant.
Index Definitions:
S&P 500 Index – This Index is a capitalization-weighted index of 500 stocks. The Index is designed to measure performance of a broad domestic economy through changes in the aggregate market value of 500 stocks representing all major industries.
Russell 1000 Growth Index – This Index measures the performance of the large cap growth segment of the U.S. equity universe. It includes those Russell 1000 companies with relatively higher price-to-book ratios, higher I/B/E/S forecast medium term growth and higher sales per share historical growth. The Index is constructed to provide a comprehensive and unbiased barometer for the large-cap growth segment. The Index is completely reconstituted annually to ensure new and growing equities are included and that the represented companies continue to reflect growth characteristics.
Russell 1000 Value Index – This Index measures the performance of the large cap value segment of the U.S. equity universe. It includes those Russell 1000 companies with relatively lower price-to-book ratios, lower I/B/E/S forecast medium term growth and lower sales per share historical growth. The Index is constructed to provide a comprehensive and unbiased barometer for the large-cap value segment. The Index is completely reconstituted annually to ensure new and growing equities are included and that the represented companies continue to reflect value characteristics.
Russell Midcap Value Index – This Index measures the performance of the midcap value segment of the U.S. equity universe. It includes those Russell Midcap Index companies with relatively lower price-to-book ratios, lower I/B/E/S forecast medium term growth and lower sales per share historical growth. The Index is constructed to provide a comprehensive and unbiased barometer of the mid-cap value market. The Index is completely reconstituted annually to ensure larger stocks do not distort the performance and characteristics of the true midcap value market.
S&P 500 Dividend Aristocrats Index – This Index tracks companies within the S&P 500 Index that have a record of raising their dividends for at least 25 consecutive years. Each company is equally weighted within the Index. S&P will remove companies from the Index when they fail to increase dividend payments from the previous year. The Index’s universe includes stocks with a float-adjusted market capitalization of at least $3 billion and an average daily trading volume of at least $5 million, in addition to consistently increasing dividend payments. The index requires a minimum of 40 companies.
