By Komson Silapachai & Emma Harper
An investor searching through ESG ETF options could easily face decision paralysis. Along with the tremendous growth of ESG ETF assets to over $25 billion in 2020, the number of ESG ETFs has also exploded to roughly 125 in 2020, up from a handful a few years ago.
The primary reason there are so many ESG ETFs available today is that no industry-wide consensus exists about the right way to integrate ESG factors into a portfolio. Oftentimes, two funds with “ESG” in their names could have completely different sector exposures, integration methodologies, exclusions, and levels of concentration. The differences lie in the way they are constructed.
Most ESG ETFs are passive, meaning they follow an index, which relies on various ESG research organizations to evaluate companies’ ESG practices and policies. The index providers create many different ESG indexes simply because there are so many different shades of ESG integration today. Know someone looking to invest in diversity and inclusion leaders? There’s an index for that. What about an investor who wants to exclude thermal coal but not nuclear power (and vice versa)? There are indexes for that. There are also indexes that comprise low carbon leaders, green bonds, and women’s leadership, to name a few.
Do more choices result in better outcomes for the end investor? Not necessarily. In his 2004 bestselling classic, The Paradox of Choice – Why More Is Less, psychologist Barry Schwartz explored the concept that more options do not necessarily increase one’s capacity to make a decision; instead they often serve as an obstacle to making a decision.
While the increase in options for ESG ETF investors means they can be very specific about the values with which they align, the other goal of ESG investing – equal or better returns than a conventional fund – can become harder to achieve. This requires a level of active risk management to ensure the ESG ETFs chosen are meeting a strategy’s risk/return profile.
A Survey of U.S. Equity ESG ETFs
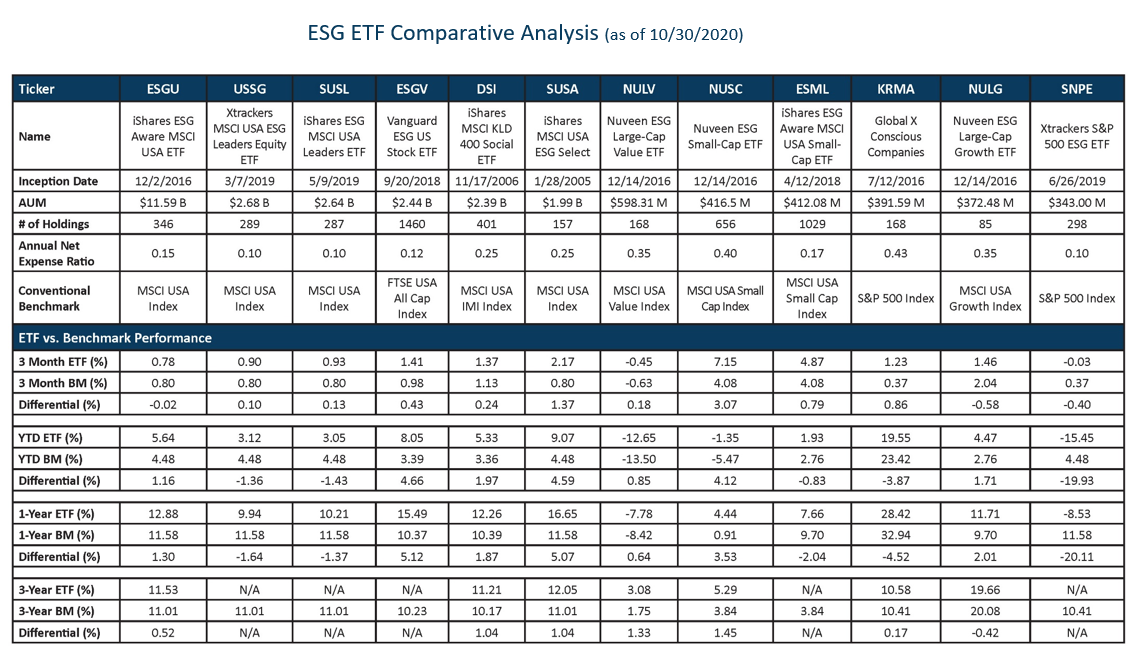
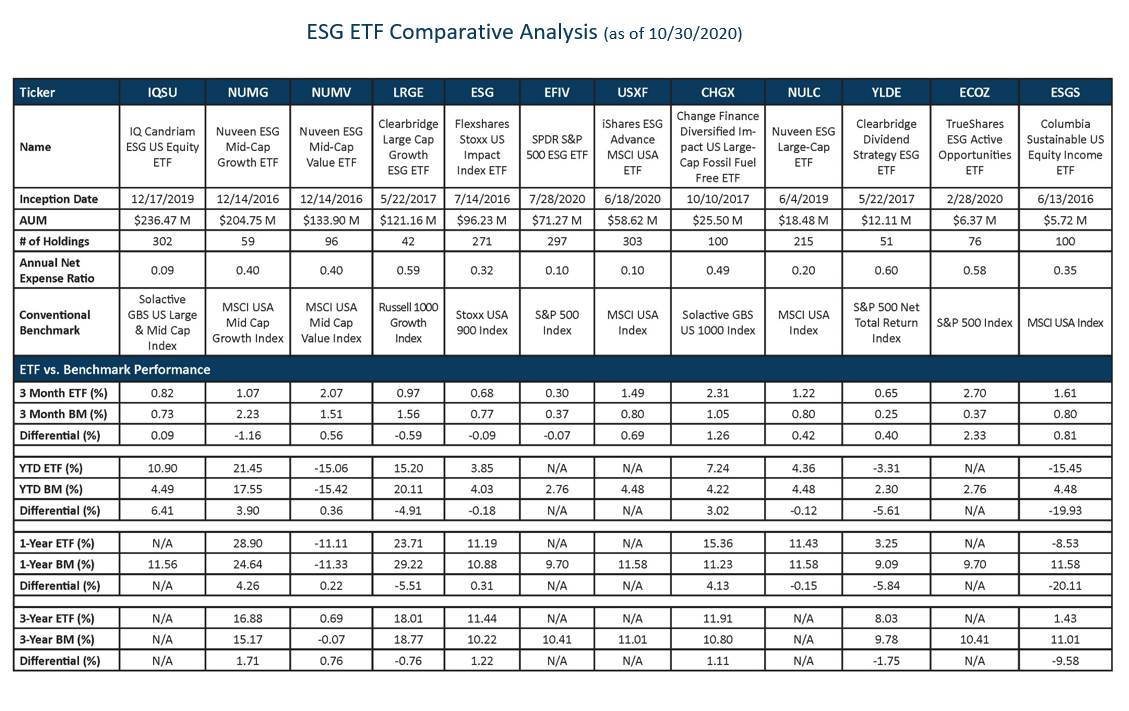
Sage examined the 24 largest U.S. equity ESG ETFs that have an ESG-integration approach. These ETFs total roughly $25 billion in assets. iShares and Nuveen are the ETF providers with the largest selection within U.S. equities, with six ETFs each; however, iShares has roughly 70% market share with $17.5 billion in assets.

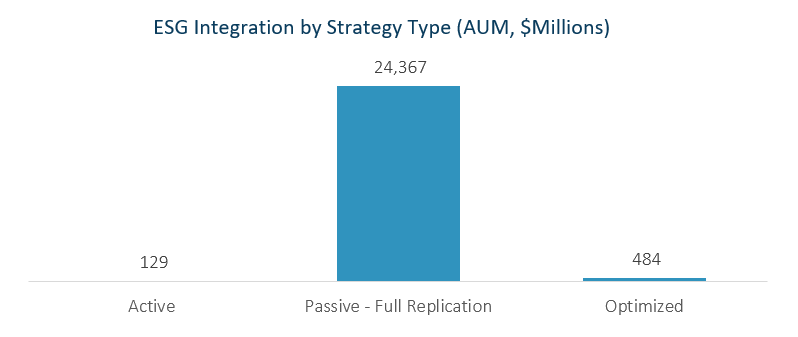
Most assets (97%) within this category are passively managed, underscoring the importance of the role each index or data provider plays for a given ETF.
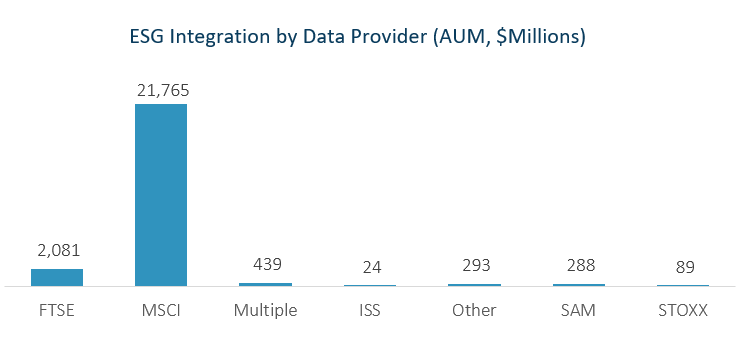
MSCI has a hold on this market as the No. 1 provider of indexes in this category, as well as being the No. 1 research and data provider that informs those indexes, with $21.8 billion in assets, or 87% in market share.


An Important Question for ESG ETF Investors
While we chose to look at ETFs that integrate ESG factors into the security selection process, most large U.S. equity ESG ETFs also include restrictions on certain industries that are widely considered to be less ESG friendly. The table below outlines the number of ETFs with restrictions, ranked by the most common issues: controversial weapons, nuclear energy, tobacco, coal, small arms, and fossil fuels.

Exclusionary practices have been around since the early days of socially responsible investing (SRI), but unlike ESG integration, SRI tended to exclude large sectors of the market, making it difficult for investors to achieve a level of diversification that is necessary for returns to outperform over time.
Because of this, one of the most common questions that still exists for ESG today is, do investors give up returns by integrating ESG factors? We believe that this is the wrong question for investors to be asking. The more important question is, what types of risk relative to the conventional benchmark does one take on because of the ESG methodology implemented in a particular ETF? This deviation from the benchmark’s performance is called tracking error and it can indicate that there’s a risk or trade-off in investing in a particular ETF.
As the number and shades of ESG ETFs continues to rise, it’s important to note that not all ESG ETFs are created equal, and as most of them passively follow an index, neither are their indexes.
The following table outlines the methodologies of four U.S. large-cap core equity ESG ETFs. The key takeaway is that index selection – especially those tracked closely by passively managed ETFs – matters quite a bit.

All four ESG indexes use some form of ESG score to screen names for the portfolio, and they are constructed using various forms of negative screening. Where they start to diverge is in their levels of security concentration, as seen in the MSCI USA ESG Select with only 157 names, compared to the S&P 500 ESG with 299 names and the MSCI Extended ESG Focus with over 300 names. Those levels of concentrations along with other sector/style tilts result in higher expected tracking error versus a conventional benchmark.
This goes to the heart of the trade-off we posed before – tracking a conventional index versus a higher concentration of ESG names (which would consequently garner a higher ESG fund score from third parties). For a given passive strategy, it is the knowledge of the sources of this risk that matters most in choosing or constructing a portfolio of ETFs. For example, as of this writing, most of the tracking error expected from the MSCI USA ESG Leaders Index comes from its underweight to the FAANMG (Facebook, Apple, Amazon, Netflix, Microsoft, and Google) names. Conversely, the S&P 500 ESG and MSCI Extended ESG Focus indexes have a much higher weight to those names. Given the record market concentration in the largest-capitalization technology stocks, this difference can have a big effect on financial outcomes.
This information is particularly essential to asset allocators because with the knowledge of the sources of tracking risk, the ETFs following these indexes can be used as tools to construct an efficient portfolio for a given client’s dual objectives of return and sustainability. Want to closely track the benchmark? Own more EFIV or ESGU. Want to increase third-party sustainability ratings? Own more SUSA and USSG.
Index Construction and Performance Observations
Our analysis of the 24 largest ESG-optimized U.S. equity ETFs revealed a variety of risk and diversification considerations for investors. First, the asset size of the ETFs varied significantly within a range of $5.7 million to $11.6 billion in AUM with the average AUM totaling just over $1 billion as of 10/31/2020. These size differences suggest that investors should weigh the relative liquidity and trading costs associated with each of the ETFs because they can vary significantly depending upon the size and timing of potential transactions. This may also impact each of the ETFs’ relative performance and tracking efficiency over time.
We found that most of the ETF providers utilized a variety of different customized indices to reflect their brand of ESG optimization, which may create some confusion for investors when determining a preferred ESG and market risk profile. Knowing and understanding the risk characteristics and sector weightings between the index providers is a key investment consideration, particularly when the complexity of unique ESG screens and exclusion policies are added to the investment portfolio construction and evaluation process.
In our evaluation process, we looked at each of the ETFs’ relative performance in comparison to its portfolio construction benchmark as well as the conventional market index that best reflected the risk profile and style of the ETF portfolio. We found that the large and mid-cap blend category was the dominant style, with 12 of the ETFs utilizing benchmarks oriented this way across three different index providers. The large-cap growth sector was the next largest category with six of the ETFs utilizing a large-cap growth index across two different index providers. There were only two value-oriented ETFs focused on the large and mid-cap sectors and one small cap-oriented ETF.
The actual number of holdings per ETF varied significantly from 42 to 1,460 companies, with an average of 302 companies. Even within ETFs focused on the same market sector and style, we found the number of constituent holdings varied quite a bit despite their similar fund titles. Moreover, the relative return outcomes within this group of ETFs varied significantly despite their similar base index and fund titles. This suggests that investors would be well served to fully understand a given ETF’s portfolio construction process relative to its underlying market index and what those differences may imply in terms of tracking error and potential return outcomes relative to its benchmark.
Lastly, it is worth noting that the relative performance of the ETFs in our survey achieved competitive returns versus similar conventional market indexes. Indeed, thru 10/31/20 the 14 ETFs within our survey with a three-year track record generated a weighted average annualized excess return of 45 basis points versus the conventional market indices. Moreover, the entire survey universe generated an impressive average excess return of 127 basis points for the last year compared to their respective conventional market indices.
The Role of an Active Manager
Constructing a diversified ESG ETF portfolio involves many layers of active risk decisions, including asset class mix, region and style exposures, as well as considering the way in which ESG is defined. It is these tradeoffs that we at Sage are faced with every day – to marry client risk tolerance and ESG values with the growing choices of ETFs in the market.
It is also important for us to consider the ETF provider’s stewardship role, which is formally recorded in our Annual ETF Stewardship Survey. Because the ETF providers represent investors in such activities as proxy voting and company engagements, it is incumbent upon them to act in the best interest of their ESG investors. We weigh the effectiveness of an ETF sponsor’s engagements with respective portfolio companies to serve as a tie breaker when deciding between two seemingly similar ESG ETFs and to fulfill our engagement role as an independent ETF strategist.
In trying to solve the “Paradox of Choice” that presents itself in the proliferation of ESG ETFs, deconstructing the funds and underlying indexes does not necessarily make the choice easier, but it illuminates the tradeoffs inherent in ESG investing. Understanding the amount and source of tracking error and how it relates to the ESG profile of a fund, then marrying that with an investment and portfolio construction process are the foundations from which an investor can build a portfolio of funds that can achieve the double bottom line of market outperformance and alignment with sustainability values.
Originally published by Sage Advisory
Disclosures
Sage Advisory Services, Ltd. Co. is a registered investment adviser that provides investment management services for a variety of institutions and high net worth individuals. The information included in this report constitute Sage’s opinions as of the date of this report and are subject to change without notice due to various factors, such as market conditions. This report is for informational purposes only and is not intended as investment advice or an offer or solicitation with respect to the purchase or sale of any security, strategy or investment product. Investors should make their own decisions on investment strategies based on their specific investment objectives and financial circumstances. All investments contain risk and may lose value. Past performance is not a guarantee of future results. Sustainable investing limits the types and number of investment opportunities available, this may result in the Fund investing in securities or industry sectors that underperform the market as a whole or underperform other strategies screened for sustainable investing standards. No part of this Material may be produced in any form, or referred to in any other publication, without our express written permission. For additional information on Sage and its investment management services, please view our web site at www.sageadvisory.com, or refer to our Form ADV, which is available upon request by calling 512.327.5530.