
By Michael W Arone, CFA, State Street Global Advisors
“Ain’t nothin’ gonna break my stride
Nobody gonna slow me down, oh no
I got to keep on movin’”
— Break My Stride, song lyrics by Matthew Wilder, 1983
Throughout summer investors have been inoculated against various potentially infectious market diseases — the Delta variant surge, China’s regulatory crackdown across a number of domestic industries, D.C. dysfunction, Federal Reserve taper talk, the US withdrawal from Afghanistan, global weather disasters, plummeting consumer confidence and an economic growth scare. Perhaps investors have already received their booster shots, fueling their feelings of invincibility against plausible market risks. Despite all the possible doom and gloom scenarios, markets are at all-time highs1 and valuations remain above their long-term averages.2 So, what is the engine that keeps stocks climbing that proverbial wall of worry to reach new heights? Simply, it’s outstanding corporate earnings results.
Come on Feel the Noise
Investors have quieted one noisy distraction after another this summer and that hairy list of risks hasn’t moved markets because revenues, earnings growth and profit margins have been phenomenal. And, it hasn’t been just the latest quarter (Q2’21) — it’s been the past five quarters dating back to last year (Q2’20). According to FactSet, S&P 500 companies on average over the past five quarters (Q2’20–Q2’21) are reporting earnings that are 19.3% above analysts’ expectations — an earnings surprise percentage notably above the 5-year average of 7.8%.
S&P 500 CY 2021 EPS Estimate — Calendar Year Trend
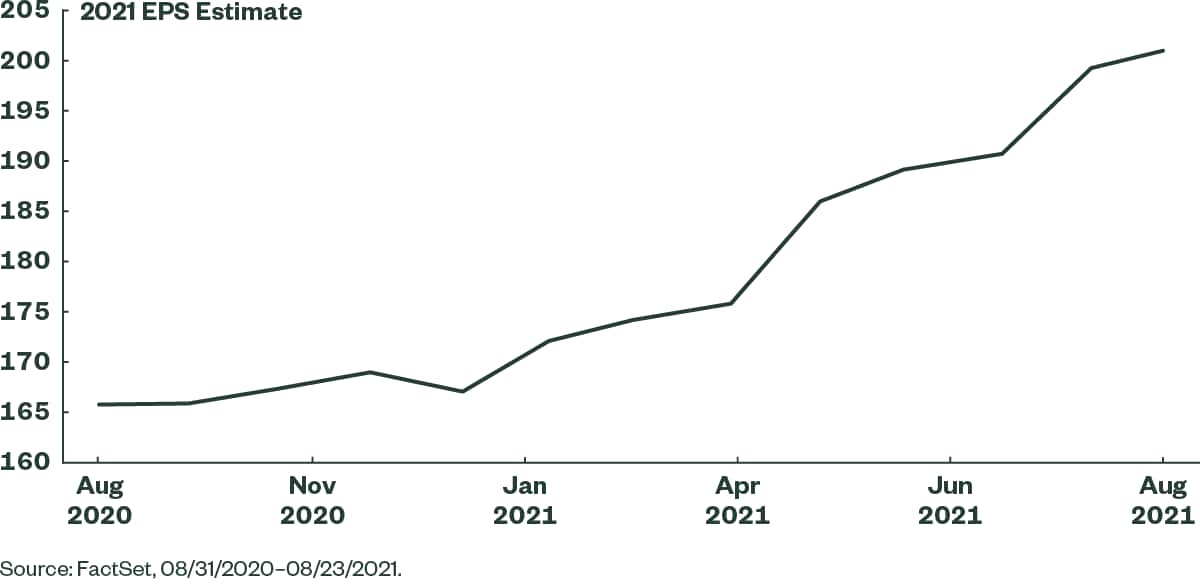
If, as most analysts expect, the second quarter represents the post-pandemic peak in revenue, earnings and profit margin growth rates, at least the quarter will have gone out with a bang! According to FactSet, as of August 13, 87% of S&P 500 companies reported both revenue and earnings surprises for the second quarter. This marks the highest percentage of S&P 500 companies reporting revenues above estimates (87%) and the highest revenue surprise percentage (4.9%) for a quarter since FactSet began tracking these metrics in 2008. Amazingly, companies were able to beat revenue expectations despite the fact that analysts kept raising the bar. For example, on March 31, the estimated revenue growth rate for the S&P 500 for Q2’21 was 16.6%. By June 30, it was 19.4%. Today, the year-over-year revenue growth rate for the second quarter of 24.9% marks the highest reported figure by the S&P 500 Index since FactSet began tracking this metric in 2008.
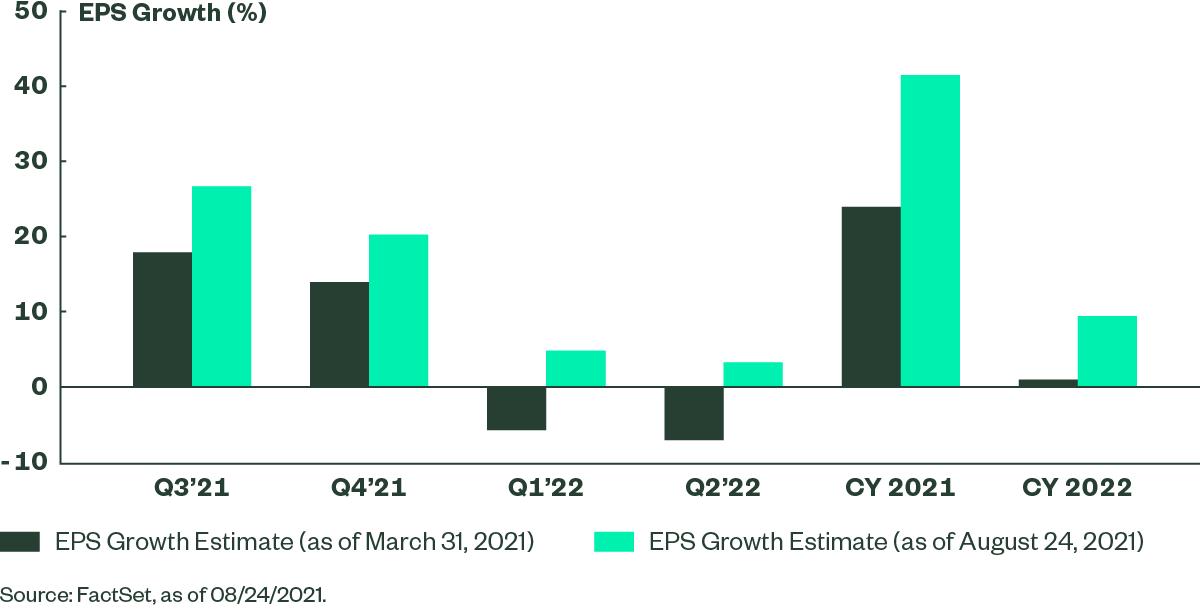
S&P 500 EPS Growth Estimates
The year-over-year earnings growth rate for the S&P 500 for the second quarter is a whopping 89%, the highest reported figure since the fourth quarter of 2009. The unusually high growth rate is due to higher earnings in Q2’21 and an easier year-over-year comparison to lower Q2’20 earnings as the result of COVID-19’s negative impact on a number of industries. All eleven sectors reported year-over-year earnings growth, led by the energy, industrials, financials, consumer discretionary, and materials sectors.
The S&P 500’s second quarter net profit margin of 13% — above both the 5-year average of 10.6% and the previous quarter’s record 12.8% and the highest since FactSet began tracking this metric in 2008 — is the biggest surprise of the earnings season. With supply chain challenges and rising inflation making headlines all year, investors have widely expected higher costs to eventually slash businesses profit margins. However, all eleven sectors are reporting a year-over-year increase in their net profit margins, led by the financials, industrials and materials sectors. So far, in aggregate, supply chain disruptions and higher input costs have not cut S&P 500 companies’ profit margins.
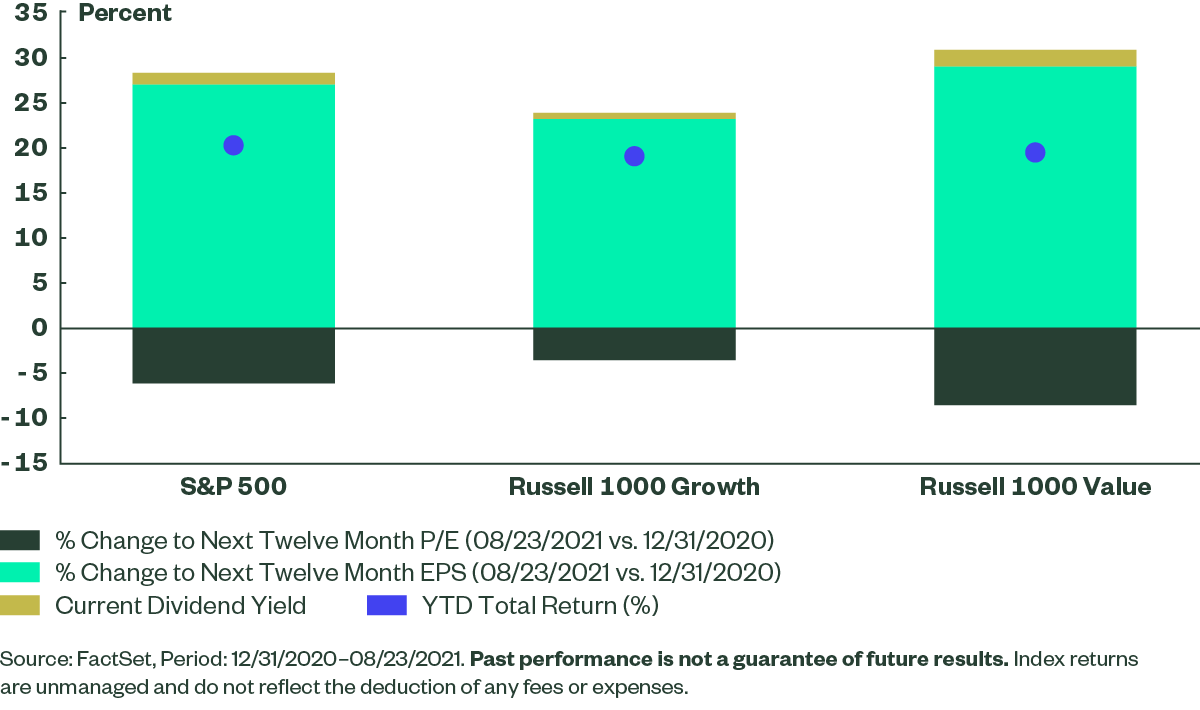
Finally, there’s another strange twist to all these magnificent corporate earnings results. While the market rally continues, stock prices have struggled to keep pace with surging earnings forecasts. As a result, forward price-to-earnings multiples have been declining, falling from 23.2 last August to 20.6 today. Lower price-to-earnings multiples give investors false confidence that valuations are becoming more attractive and that stock prices will catch up to earnings growth. This underscores how earnings have been the overwhelming driver of huge stock price gains during the past year.
S&P 500 Forward P/E Ratio

Don’t Let it End
Ironically, if stellar earnings results are indeed the primary reason markets keep setting all-time highs, it just might be that future earnings results are the market’s biggest risk.
Revenue and earnings surprises have been so big over the past five quarters because analysts have persistently underestimated both since the middle of last year. And as analysts have continued to increase their estimates to account for this unanticipated growth, declining forward price-to-earnings multiples have encouraged investors to look past stretched valuations and to assume that corporate earnings will always easily beat expectations.
However, that’s not typically how it works. At the beginning of each year, analysts’ earnings estimates are generally far too rosy and are gradually lowered throughout the year, allowing companies to modestly beat expectations. And it’s starting to look like this old pattern may be making a comeback. Even as investors are busy celebrating this year’s astonishing earnings results, analysts have begun to sharpen their forecasts for 2022 earnings. Just a few weeks ago, analysts were forecasting 11.4% earnings growth for S&P 500 companies next year. However, that figure was recently slashed to 9.1% — still healthy, but next year’s actual earnings growth rate might be closer to 5%. Will that be enough to satisfy investors given the big returns of the past two years, markets at all-time highs and lofty valuations?
YTD Returns Driven by Robust Growth in EPS Expectations
After five consecutive quarters of eye-popping earnings numbers that have enabled investors to ignore a variety of market risks, the future may bring a wake-up call like the one several tech giants recently delivered. Although these companies solidly beat revenue and earnings estimates for the second quarter, shares were pummeled when the companies lowered guidance.3 Merely suggesting that future revenue and earnings growth rates could be less spectacular sent shares reeling. If this investor reaction spreads to other economic sectors, the market rally could be in for a rough patch.
Footnotes
1 FactSet, Period: 01/03/1928–07/31/2021. S&P 500 used to represent the overall market.
2 FactSet, Period: 09/29/2006–07/31/2021. S&P 500 used to represent the overall market.
3 Ben Levisohn, “Stocks Are Sturdier Than Big Tech’s Tumble Suggests,” Barron’s, July 21, 2021.
Glossary
Earnings per share (EPS): A figure describing a public company’s profit per outstanding share of stock, calculated on a quarterly or annual basis.
S&P 500 Index: A stock market index tracking the performance of 500 large companies listed on stock exchanges in the United States. It is one of the most commonly followed equity indices.
Originally published by State Street on August 30, 2021.
Disclosures
The returns on a portfolio of securities which exclude companies that do not meet the portfolio’s specified ESG criteria may trail the returns on a portfolio of securities which include such companies. A portfolio’s ESG criteria may result in the portfolio investing in industry sectors or securities which underperform the market as a whole.
Investing involves risk including the risk of loss of principal.
The whole or any part of this work may not be reproduced, copied or transmitted or any of its contents disclosed to third parties without State Street Global Advisors’ express written consent.
