
By Jane Street
ESG-conscious investing continues to drive headlines, and the data shows that market activity in ESG-related ETFs is increasing. Like most ETFs early in their life-cycle, trading volume for ESG ETFs currently skews “dark” with a high percentage of volume resulting in creations. As they mature, we would expect on-exchange volume to pick up particularly for the products that continue to attract assets.
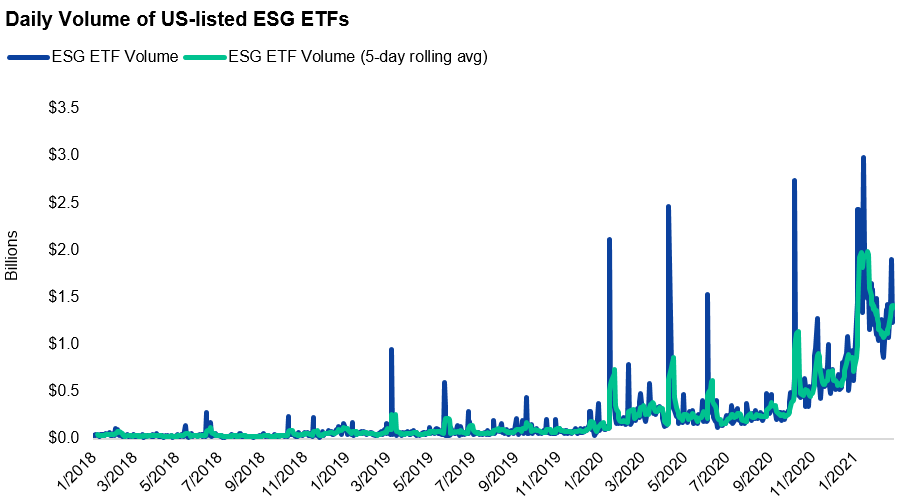
Source: Bloomberg, as of 02/28/2021. ETFs include those categorized as either ESG, socially responsible, environmentally friendly, clean energy, or climate change.
ESG OTC and Primary Market Activity Similar to ETFs of Comparable Size and Maturity
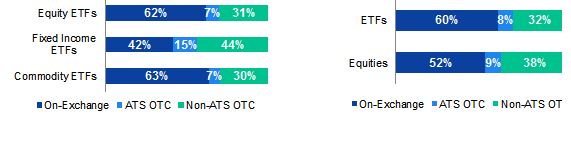
When compared to overall ETF volumes, a significantly higher portion of ESG ETF trading occurs OTC. This is likely due to the category of ESG and sustainable ETFs being less established. Slightly more than half of today’s ESG ETFs were launched after 2017 and their median fund size is currently just $111 million. Activity in ESG ETFs mirrors what we see in other new or comparatively low AUM ETFs, where medium-to-large orders that are smaller than the creation unit size can be difficult to work in the market. This is because market makers may only carry a limited number of shares until two-sided flows become more regular. In contrast, market makers can work with issuer capital market desks as well as the end institution to meet demand efficiently OTC.

Source: Bloomberg, FINRA, as of 12/31/2020. Chart displays percent of 2020 notional volume executed on-and-off-exchange for the respective groupings of US listed ETFs.
Across the entire US ETF industry, approximately 20% of ETF volume results in primary market activity. Conversely, in our ~3-year sample about 51% of ESG ETF volume resulted in primary market activity. This higher-than-average rate may be a result of ESG ETFs flow’s tendency to be “one-sided.” When natural two-way volume (as displayed) is limited, larger trades are almost always going to result in a creation. This makes sense given most of these strategies started the period with minimal assets and have seen investor demand that can only be met through ETF creations. We’d expect this proportion to decrease overtime as funds gain scale and initial investors’ positions mature leading to more natural buying and selling between ETF investors.

Source: Bloomberg, as of 02/28/2021
ESG ETFs Tend to Share Characteristics with Other Buy-and-Hold ETFs
While some ETFs tend to show higher on-screen volumes due in part to institutional investors using them for tactical allocation decisions, other ETFs tend to be utilized for more strategic allocations. Given the assumed long-term nature of ESG investors it is not surprising that ESG ETFs tend to exhibit lower share turnover. In the charts below we highlight examples of ETFs that provide exposure to the same general market segment.
We selected high ADV ETFs (SPY US and EEM US), a lower expense ratio alternative from the same issuer (SPLG US and IEMG), and the largest ESG ETF in the respective category (ESGU and ESGE US). We see the ESG and lower expense ratio ETFs exhibit consistently lower share turnover despite both funds experiencing meaningful asset growth over the past few years. This is likely due to investors in these funds having a longer-term time horizon which allows them to place less emphasis on ADV since they are less likely to trade in and out of the product frequently.
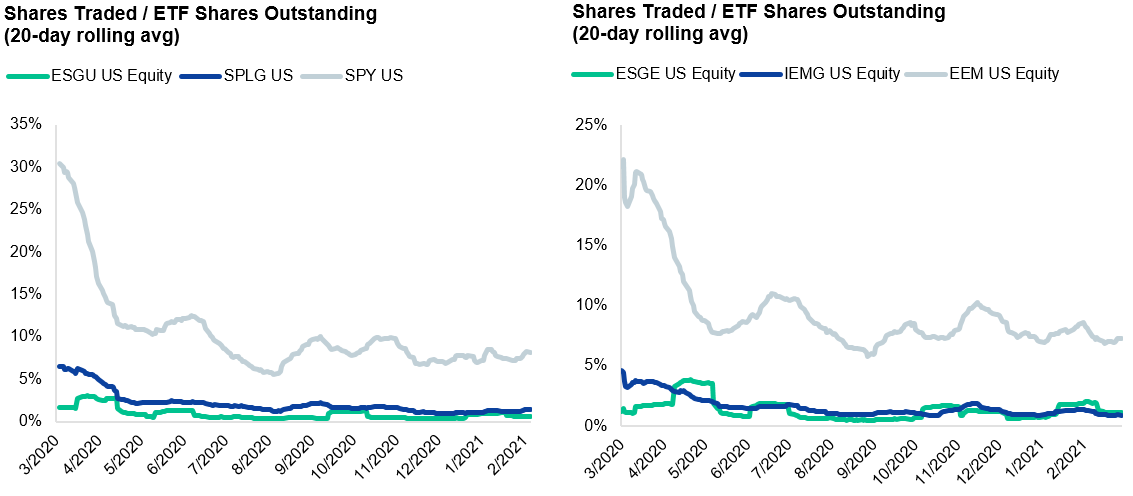
Source: Bloomberg, as of 02/28/2021
To meet the growing investor demand for ESG products, many Issuers have released ESG equivalents of traditional exposures. For example, SPDR’s EFIV US, which launched in 2020, is an ESG equivalent of SPY US. Given the limited trading history of many ESG ETFs, below we look at the short-term correlations of traditional and ESG-equivalent equity indices. From a market maker’s perspective we are often able to trade ESG products in a similar manner to their non-ESG equivalents because managing market risk can be analogous. A market maker’s natural trading in the other non-ESG ETFs can be used to offset risk. Additionally, the high short-term correlation between ESG and traditional indexes allows market makers to use traditional hedging instruments such as futures and options on major indexes to manage any short-term market risk. It is worth noting that ESG-specific derivatives are also becoming increasingly common. Increased volumes in ESG ETFs and ESG derivatives should result in a positive feedback loop that allows liquidity to continue to build over time.

Source: Bloomberg, as of 02/28/2021
New and Notable from the Desk
Recent data from Rosenblatt Securities shows that closing auction market share for US-listed securities dropped to 4.1% in February, the lowest since August 2015. Closing auction market share reached a high of 11.6% in December 2019 before Covid-19-related volatility and the subsequent surge in retail investor participation bolstered volumes in the continuous session.
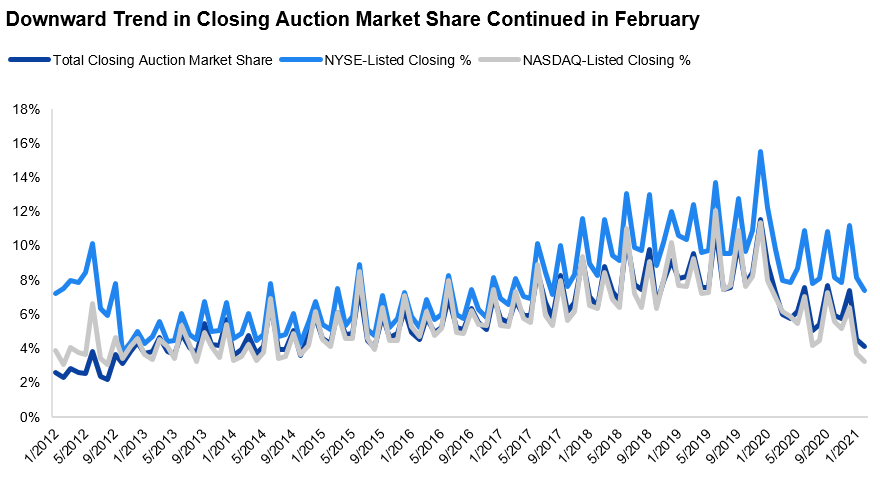
Source: Rosenblatt Securities, as of 02/28/2021
ETF Trading Highlights
On/Off-Exchange Trading Volume
Source: FINRA and Bloomberg data for the two weeks ending January 29, 2021. Data on exchange-traded managed funds (ETMFs) are not captured. The Bloomberg data do not include some NAV trades.
Net Market Flow by Asset Class ($M, 10 Days vs 20 Days)

Source: Bloomberg as of February 26, 2021. Data on exchange-traded managed funds (ETMFs) are not captured. The data do not include some NAV trades.
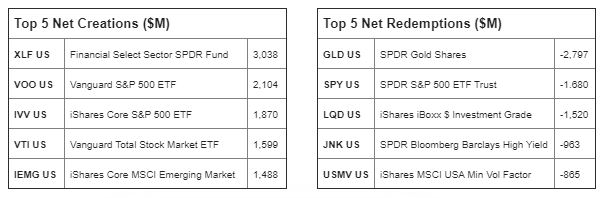
Source: Bloomberg for the 10 days ending February 26, 2021. Data on exchange-traded managed funds (ETMFs) are not captured.
© 2021 Jane Street Group, LLC. All rights reserved. Issued in the United States by Jane Street Execution Services, LLC (JSES), a U.S. registered broker-dealer and member of FINRA (https://clicktime.symantec.
