By Liyu Zeng, Director, Global Research & Design, S&P Dow Jones Indices
With the launch of the S&P Global Carbon Efficient Index Series in 2018, S&P DJI introduced the S&P Carbon Global Standard, a proprietary carbon classification system that assigns carbon deciles to companies within their respective industry groups. The framework uses carbon-to-revenue footprint (carbon intensity) for companies in the S&P Global LargeMidCap to determine carbon decile thresholds for each industry group and defines companies’ carbon deciles according to these thresholds.
To compare the carbon efficiency of Asian companies with their global peers, we evaluated the carbon decile ranks of companies in the S&P Global BMI Series[1] for Australia, Hong Kong, Japan, South Korea, China, India, and Taiwan. We compared the distribution of companies across high- (1st-3rd), mid- (4th-7th), and low-carbon deciles (8th-10th) within each industry group for each market.
A higher proportion of companies in high- (low-) carbon deciles implies companies in that industry group tended to be more (less) carbon efficient than their global industry group peers (in green and red, respectively).

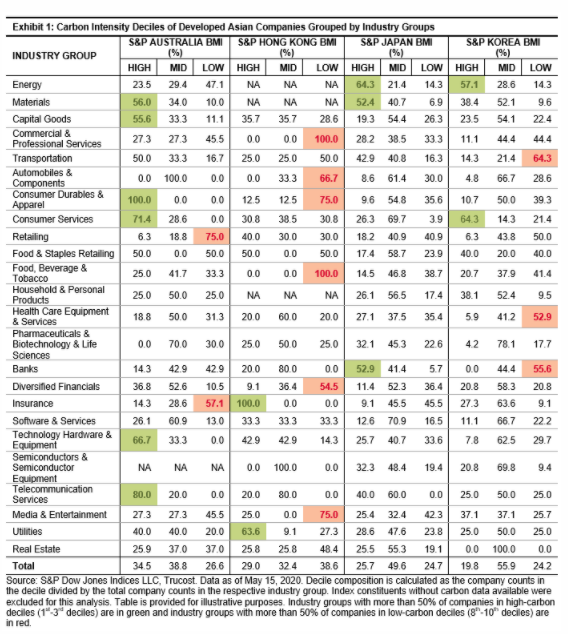
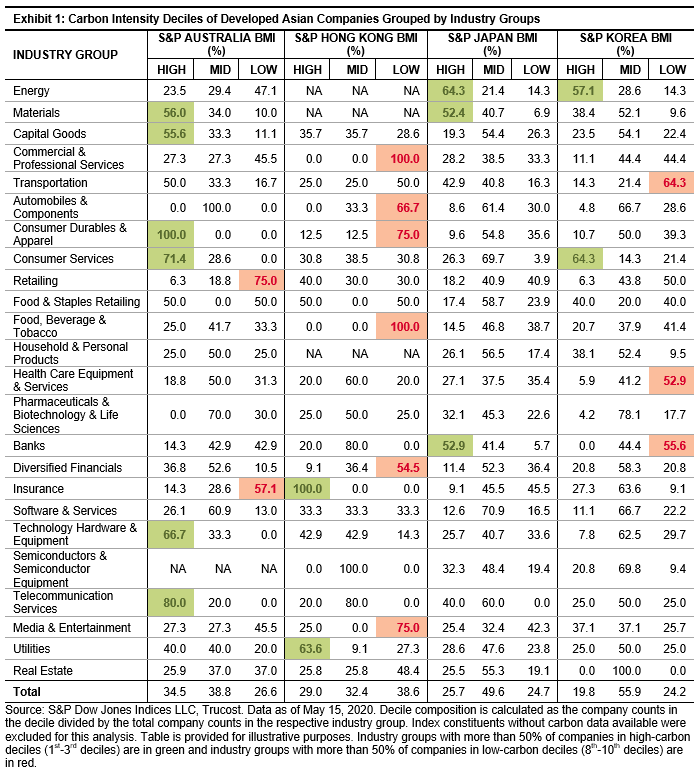
 Australia had the highest portion of high-carbon decile ranked companies (34.5%), while Hong Kong had the highest percentage of lower-carbon decile ranked companies (38.6%). Carbon decile ranks for Materials companies were the most favorable across developed Asian markets, with a higher concentration of companies in high- versus low-carbon deciles. In contrast, more companies with a low-carbon rank were seen in Commercial & Professional Services and Food, Beverage & Tobacco.
In Australia, a majority of Consumer Durables & Apparel, Telecommunication Services, Consumer Services, Technology Hardware & Equipment, Materials, and Capital Goods companies were in high-carbon deciles, while a larger portion of low-carbon decile ranked companies were seen in Retailing and Insurance.
In contrast, most Commercial & Professional Services, Food, Beverage & Tobacco, Consumer Durables & Apparel, Media & Entertainment, Automobiles & Components, and Diversified Financials companies received low-carbon decile ranks in Hong Kong, and a high concentration in high-carbon deciles was only seen in Insurance and Utilities.
Over 50% of Japanese Energy, Banks, and Materials companies had favorable decile ranks, while the highest concentration of low-carbon decile ranked companies was found in Insurance, Media & Entertainment, and Retailing.
In South Korea, 64.3% of companies in Consumer Services received high decile ranks, while over 50% of companies in Transportation, Banks, and Health Care Equipment & Services ranked in low deciles compared with their industry group peers.

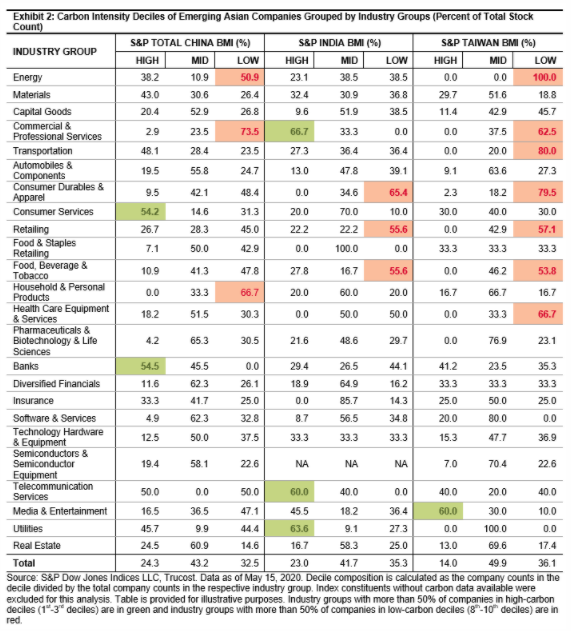
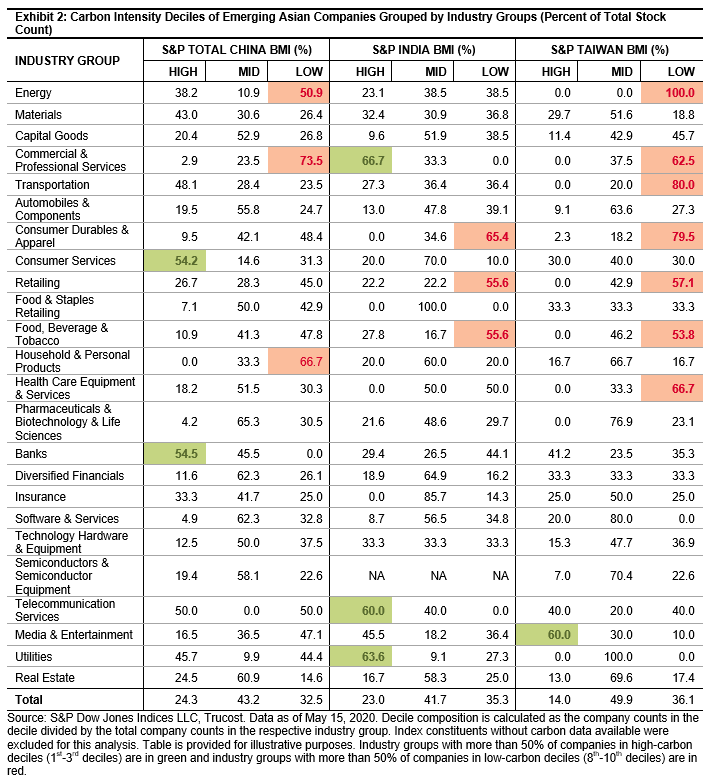
 Among emerging Asian markets, the percentage of companies in low-carbon deciles tended to be higher than those in high-carbon deciles, and Taiwan had the highest number of industry groups with a high concentration in low-carbon decile companies. Emerging Asian market companies tended to be less carbon efficient than those in developed Asian markets. Carbon decile ranks for companies in Consumer Durables & Apparel, Retailing, and Food, Beverage & Tobacco tended to be the least carbon efficient among emerging Asian markets.
Over 50% of Chinese Banks and Consumer Services companies were ranked in high-carbon deciles, while over 50% of companies in Commercial & Professional Services, Household & Personal Products, and Energy received low decile ranks.
A high concentration of high-carbon deciles was seen in Indian Commercial & Professional Services, Utilities, and Telecommunication Services companies, while the highest portion of companies in Consumer Durables & Apparel, Retailing and Food, Beverage & Tobacco received low-carbon decile ranks.
In Taiwan, Media & Entertainment was the only industry group with over 50% of companies ranked in high-carbon deciles. A majority of companies in Energy,[2] Transportation, Consumer Durables & Apparel, Health Care Equipment & Services, Commercial & Professional Services, Retailing and Food, Beverage & Tobacco received low-carbon decile ranks.
The S&P Global Carbon Standard not only provides a classification system to evaluate companies’ carbon efficiencies, it also serves as a critical framework for reweighting companies in the S&P Global Carbon Efficient Indices, which assign index weights toward companies with low-carbon intensities and penalizes those with high-carbon intensities to achieve an index portfolio with reduced carbon intensities.
Originally published by Indexology, 1/7/21
1 The S&P Global BMI Series is designed to measure the performance of the broad equity market of the respective country or region. For more details, please see https://www.spglobal.com/spdji/en/indices/equity/sp-global-bmi/#overview.
2 There was only one company in the Energy sector of the S&P Taiwan BMI as of May 15, 2020.
The posts on this blog are opinions, not advice. Please read our Disclaimers.

