Indexed ETFs are inherently built to remove human emotion when it comes to portfolio construction. While human beings are certainly fallible by nature, that isn’t to say rules-based indexing isn’t. A prime example is the May semiannual rebalancing of the iShares MSCI USA Value Factor ETF (VLUE). When the rebalancing smoke cleared, it left the fund with staggering 20.63% (as of June 10, 2026) allocation in semiconductor giant Micron Technology (MU). For comparison, the fund’s next largest holding is Cisco Systems (CSCO) with a 4.78% weight.
For investors seeking a value-focused ETF, this level of concentrated exposure may raise questions. In particular, what caused a value fund to wind up with such a large concentration in a volatile technology stock that has skyrocketed over 200% YTD?

See more: Get Comprehensive Value With This Cash Flow ETF Combo
The 20% Anomaly
According to its principal investment strategy, VLUE tracks the MSCI USA Enhanced Value Index. Looking closer under the hood, this index is built to isolate value stocks from the MSCI USA Index. Instead of hunting for value across the entire market, the algorithm enforces a more targeted, two-pronged mandate:
-
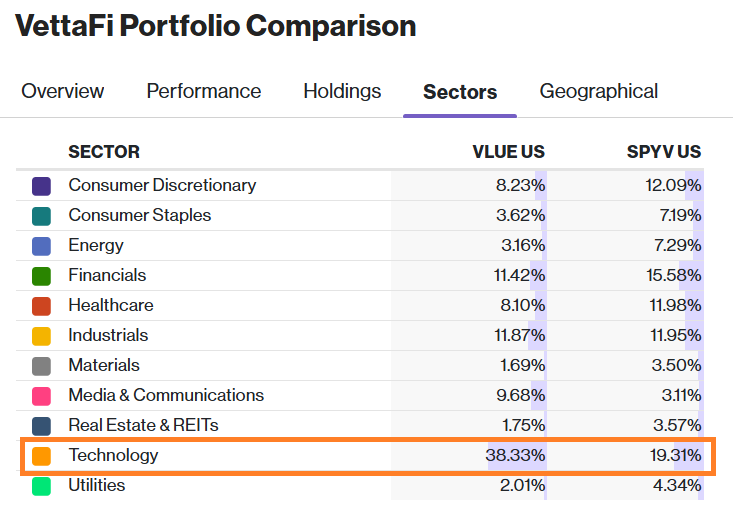
Sector-Neutral Mandate: To mitigate concentration risk in traditional value sectors like utilities or financials, the prospectus notes that component weights are normalized so that sectors in the index mirror the parent index. That said, the tech sector represents a hefty weight in the broad market so VLUE must correspond to this heavy tech tilt.
-
Forward P/E Matrix: To find value names in the MSCI USA universe, a value score is used across three fundamental metrics: price-to-book value, price-to-forward earnings, and enterprise value-to-cash flow from operations. Parabolic earnings projections for hardware and chipmakers have certainly skewed these metrics. Because the MSCI Global Semiconductor Index is trading at its lowest P/E in recent years, names like Micron are flagged as exhibiting strong value despite its astronomical rally.
Once the Index assigns its value scores, MSCI multiplies each component’s value score by its market capitalization. Because other mega-cap tech peers trade at immense valuation premiums, the index tagged Micron as a prime value play and thus, the 20% allocation.
MU PE Ratio (Forward) data by YCharts
VLUE vs. SPYV: Structural Contrast
The large allocation in Micron warrants a juxtaposition with another value fund. Comparing VLUE to the SPDR Portfolio S&P 500 Value ETF (SPYV) reveals a stark divergence in indexing methodology.
While VLUE enforces a strict sector-neutral mandate that mirrors broad market sector weights, SPYV uses an unconstrained, traditional style-box allocation. SPYV tracks the S&P 500 Value Index, maintaining weights across the aforementioned value sectors. The fund’s methodology also allows it to rotate out of overvalued, volatile sectors as a built-in defensive mechanism. The sector comparison between the two funds reveals the greater weight in tech for VLUE.
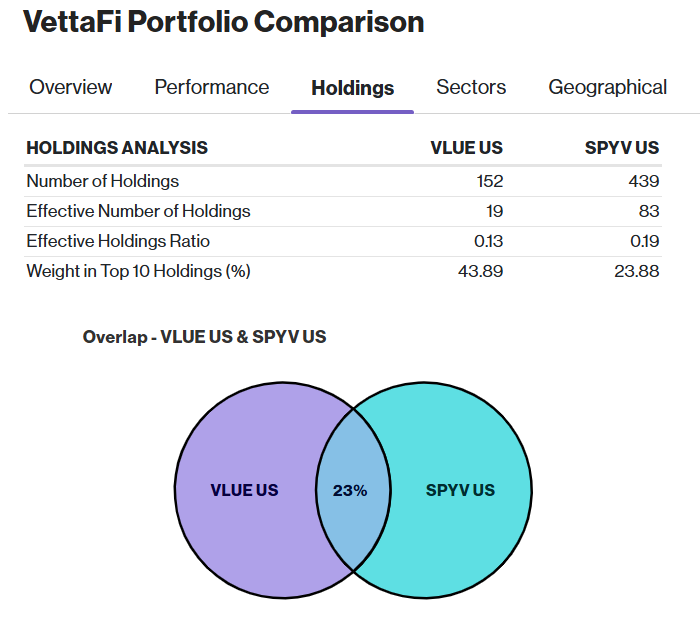
The disparity in holdings is further highlighted with only a 23% overlap. VLUE has 152 holdings compared to SPYV’s broader basket of 439 names (curiously, Micron is not one of those). The concentration risk is further intensified by VLUE’s effective number of holdings, which sits at a mere 19 versus SPYV’s more diversified 83.
Look Under the Hood
For investors, this latest rebalancing reinforces the notion that it’s important to look underneath the hood and kick the tires of various ETFs before deciding to allocate. Some investors may appreciate the high-conviction of VLUE while others may prefer the greater diversification of SPYV.
Both funds’ expense ratios are competitively priced though the enhanced value component for VLUE adds an additional 11 bps. For some, that’s a small price to pay given the fund is up over 40% YTD versus SPYV’s 6.5%. However, the recent semiconductor sell-off and the notion of the market broadening out could force a re-evaluation of whether the added performance is worth the concentration risk.
| Feature | iShares MSCI USA Value Factor ETF | SPDR Portfolio S&P 500 Value ETF |
|---|---|---|
| Ticker | VLUE | SPYV |
| Issuer | BlackRock (iShares) | State Street Global Advisors (SPDR) |
| Inception Date | April 16, 2013 | September 25, 2000 |
| Expense Ratio | 0.15% | 0.04% |
| Assets Under Management | ~$14.18 Billion | ~$35.15 Billion |
| Number of Holdings | ~152 | ~439 |
| Underlying Index | MSCI USA Enhanced Value Index | S&P 500 Value Index |
| Selection Universe | Large- and mid-cap U.S. equities scored across 3 value pillars within GICS sectors, then normalized to match parental market-cap sector weights. | Large-cap companies selected from the S&P 500 based on book value, earnings, and sales ratios without forcing sector weights. |
For more news, information, and analysis, visit the Equity ETF Content Hub.