Key Takeaways
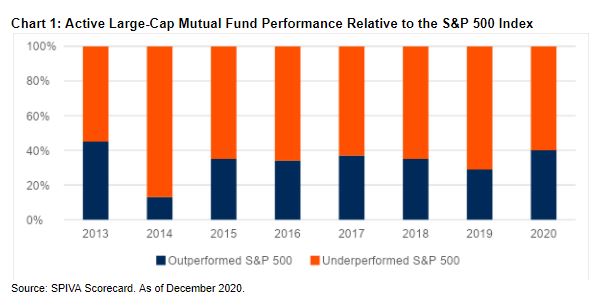
 In 13 of the last 15 calendar years, the average large-cap active mutual fund lagged the widely followed S&P 500 Index. In 2020, just 40% of large caps kept pace with the benchmark behind Vanguard S&P 500 ETF (VOO) and Vanguard 500 Index Fund (VFIAX), according to the latest SPIVA Scorecard.
- High fees eat into actively managed fund returns, with large-cap mutual funds commonly charging a 100-basis-point expense ratio. The average large-cap mutual fund lagged the S&P 500 by 170 basis points in 2020.
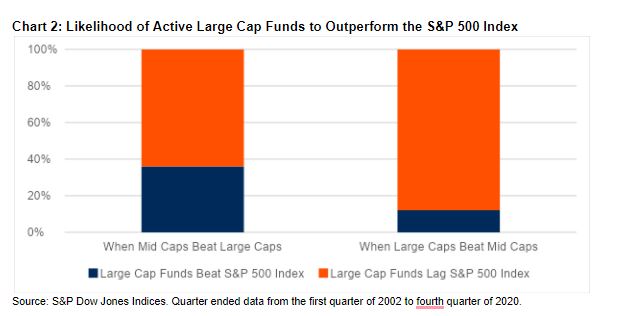
- Three times as many active large-cap funds outperformed the S&P 500 Index during quarters when the S&P MidCap 400 Index performed relatively well compared to when it lagged, a signal that active managers’ efforts to differentiate a fund often involved a smaller-cap bias.
Fundamental Context
Only four in 10 large-cap funds outperformed the S&P 500 in 2020. While last year was the best year for active large-cap funds since 2013 on a relative basis, only 40% of active large-cap funds tracked in the SPIVA Scorecard beat the prominent large-cap index. This was a modest improvement from 2019 when just 29% of large-cap mutual funds outperformed as well as the years between 2015 and 2018 when a mid-30s percentage did so as seen in Chart 1. But the persistent underperformance over the last 15 years has contributed to the growth of S&P 500 Index-based ETFs, which held over $750 billion in assets at the end of 2020.
High fees eat into returns but stock selection matters too. In 2020, on an equal weighted basis, the average large-cap mutual fund rose 16.7%, lagging the 18.4% return for the S&P 500. While active mutual funds commonly charge 1.0% or more in fees, the S&P 500 Index’s relative return is aided by the absence of fees. Yet, investors can choose between three equity ETFs – iShares Core S&P 500 ETF (IVV), SPDR Portfolio S&P 500 ETF (SPLG), and VOO – and pay an expense ratio of just 0.03% or a mutual fund version, such as VFIAX for just a basis point more.
However, fees are only part of what impacts a mutual fund and why CFRA’s fund rating methodology includes an assessment of risk and reward at the portfolio level in addition to reviewing a fund’s performance record and key costs. Active managers make discretionary decisions on what stocks to own and how much they represent in the portfolio, which ultimately drives performance.
Actively managed equity funds also do not neatly fit in a style box. While advisors and investors like to build asset allocation strategies in finding a fund for the large-, mid-, and small-cap styles, when working with discretionary managers they also need to accept that few active funds are twins. CFRA’s mutual fund rating methodology also differs from other research providers as we seek to identify what funds from a broad universe, such as Domestic Equity, have the greatest likelihood of outperforming in the next 12 months regardless of what style it falls under.
The stock selection decisions fund management makes explain why a fund will perform differently than peers or an index-based ETF. This is a key takeaway for us from a recent S&P Dow Jones report titled “Style Bias and Active Performance”. The co-authors Anu Ganti and Craig Lazzara dug into SPIVA Scorecard data between 2002 and 2020 to try to understand what (if anything) distinguishes the periods when most active managers outperformed S&P benchmarks from most of the time when they failed.
When large-cap managers outperformed the S&P 500, the S&P MidCap 400 Index was more likely to have shined brighter. Ganti and Lazzara found 42 quarters when the S&P 400 beat the S&P 500. In 15 of those instances (36% of the time), most large-cap managers outperformed the S&P 500. Meanwhile, when the large-cap index beat the mid-cap one, the likelihood a majority of large-cap mutual fund managers outperformed the S&P 500 fell to 12% (4 of 34). In both cases, an index-based investment, such as VOO, would have been most rewarding. Yet, according to Ganti and Lazzara, the data is consistent with the view large-cap managers as a group have a bias toward smaller companies.
Having a larger-cap bias relative to the S&P 500 Index is hard. At the end of 2020, the weighted average market capitalization of the S&P 500 was a whopping $437 billion. However, to have a mega-cap bias relative to the S&P 500, which likely would have helped performance, a manager would need to overweight Apple (AAPL), Microsoft (MSFT), Amazon.com (AMZN), and five other constituents in the benchmark with higher market caps than the weighted average. Meanwhile, simply overweighting more moderately sized companies in the S&P 500 Index, which likely hurt in 2020, would cause the fund to look and perform quite differently.
For example, CFRA five-star rated Fidelity Equity Income Fund (FEQIX) rose just 6.8% in 2020, lagging the S&P 500 Index, but outperforming the S&P 500 Value Index’s 1.4%. FEQIX recently held top-10 holdings in Danaher (DHR) and NextEra Energy (NEE), which are toward the lower end of S&P 500’s market-cap spectrum. The fund’s low 0.60% expense ratio coupled with its lower risk profile contribute to our favorable fund rating for 2021.
Conclusion
Perennially there are articles projecting why each year will be different enabling actively managed mutual funds to shine. But once again in 2020, most active large-cap funds failed to beat the S&P 500 Index, hurt by fees and security selection. CFRA provides forward-looking star ratings on both mutual funds and ETFs, to arm our clients with the tools to sort through the universe in hopes of finding products to own for the future. There will always be active funds outperforming. Yet, we think just choosing last year’s winners expecting a repeat performance, or last year’s laggards hoping for a reversion to the mean, is a mistake.
Todd Rosenbluth is Director of ETF & Mutual Fund Research at CFRA.